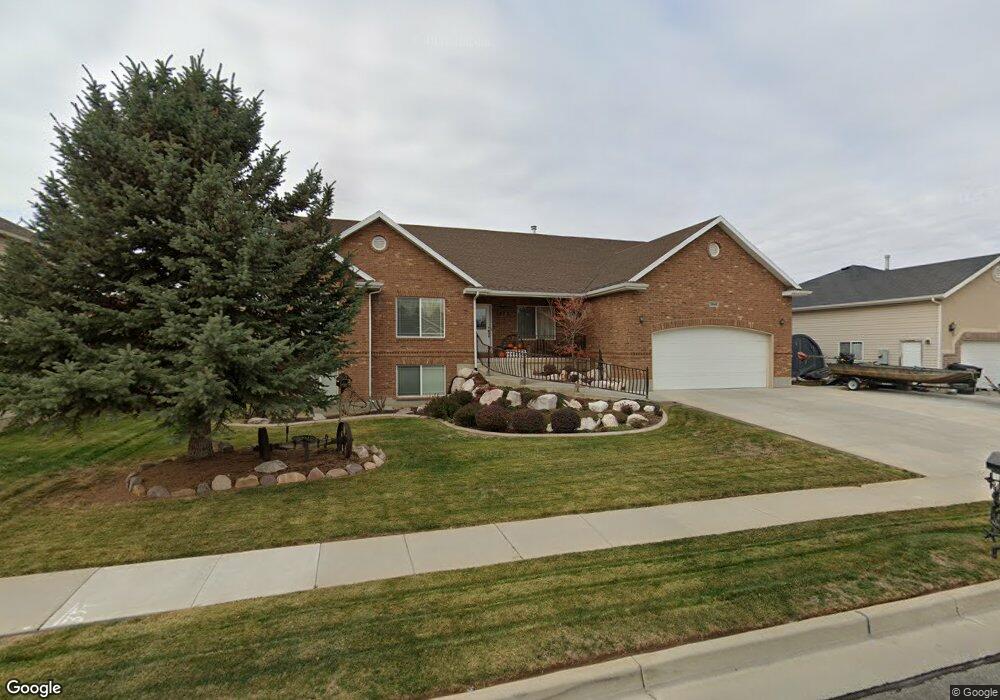
1886 S 1730 W Syracuse, UT 84075
Estimated Value: $587,000 - $610,000
3
Beds
3
Baths
1,862
Sq Ft
$320/Sq Ft
Est. Value
About This Home
This home is located at 1886 S 1730 W, Syracuse, UT 84075 and is currently estimated at $595,875, approximately $320 per square foot. 1886 S 1730 W is a home located in Davis County with nearby schools including Cook School, Syracuse Junior High School, and Syracuse High School.
Ownership History
Date
Name
Owned For
Owner Type
Purchase Details
Closed on
Sep 18, 2009
Sold by
Cummings Roger L and Cummings Linda P
Bought by
Cummings Roger L and Cummings Linda P
Current Estimated Value
Purchase Details
Closed on
Jul 16, 2002
Sold by
Northstar Property Development Inc
Bought by
Cummings Roger L and Cummings Linda P
Home Financials for this Owner
Home Financials are based on the most recent Mortgage that was taken out on this home.
Original Mortgage
$120,000
Outstanding Balance
$50,308
Interest Rate
6.69%
Mortgage Type
Construction
Estimated Equity
$545,567
Create a Home Valuation Report for This Property
The Home Valuation Report is an in-depth analysis detailing your home's value as well as a comparison with similar homes in the area
Home Values in the Area
Average Home Value in this Area
Purchase History
| Date | Buyer | Sale Price | Title Company |
|---|---|---|---|
| Cummings Roger L | -- | None Available | |
| Cummings Roger L | -- | Security Title Company |
Source: Public Records
Mortgage History
| Date | Status | Borrower | Loan Amount |
|---|---|---|---|
| Open | Cummings Roger L | $120,000 |
Source: Public Records
Tax History Compared to Growth
Tax History
| Year | Tax Paid | Tax Assessment Tax Assessment Total Assessment is a certain percentage of the fair market value that is determined by local assessors to be the total taxable value of land and additions on the property. | Land | Improvement |
|---|---|---|---|---|
| 2025 | $3,204 | $309,100 | $122,286 | $186,814 |
| 2024 | $3,211 | $311,850 | $98,648 | $213,202 |
| 2023 | $3,102 | $301,950 | $75,677 | $226,272 |
| 2022 | $3,316 | $585,000 | $144,626 | $440,374 |
| 2021 | $2,936 | $441,000 | $117,268 | $323,732 |
| 2020 | $2,627 | $382,000 | $103,399 | $278,601 |
| 2019 | $2,536 | $364,000 | $99,547 | $264,453 |
| 2018 | $2,372 | $338,000 | $96,955 | $241,045 |
| 2016 | $2,130 | $159,170 | $37,270 | $121,900 |
| 2015 | $2,088 | $148,610 | $37,270 | $111,340 |
| 2014 | $1,968 | $142,743 | $37,270 | $105,473 |
| 2013 | -- | $137,950 | $32,571 | $105,379 |
Source: Public Records
Map
Nearby Homes
- 2082 S 1730 W
- 2194 S 1800 W
- 1466 Earl Cir
- 1932 S 2150 W
- 1876 S 1230 W
- 2104 W 2200 S
- 2306 S 2000 W
- 1481 S Melanie Ln
- 2237 Craig Ln
- 2136 W 2200 S
- 1327 S 1650 W
- 1154 W 1700 S
- 1384 S Melanie Ln
- 1142 W 2050 S
- 1148 W 2050 S
- 1306 W 2325 S
- 4344 W 1825 S Unit 102
- 4354 W 1825 S Unit 104
- 4348 W 1825 S Unit 103
- 1286 W 2325 S