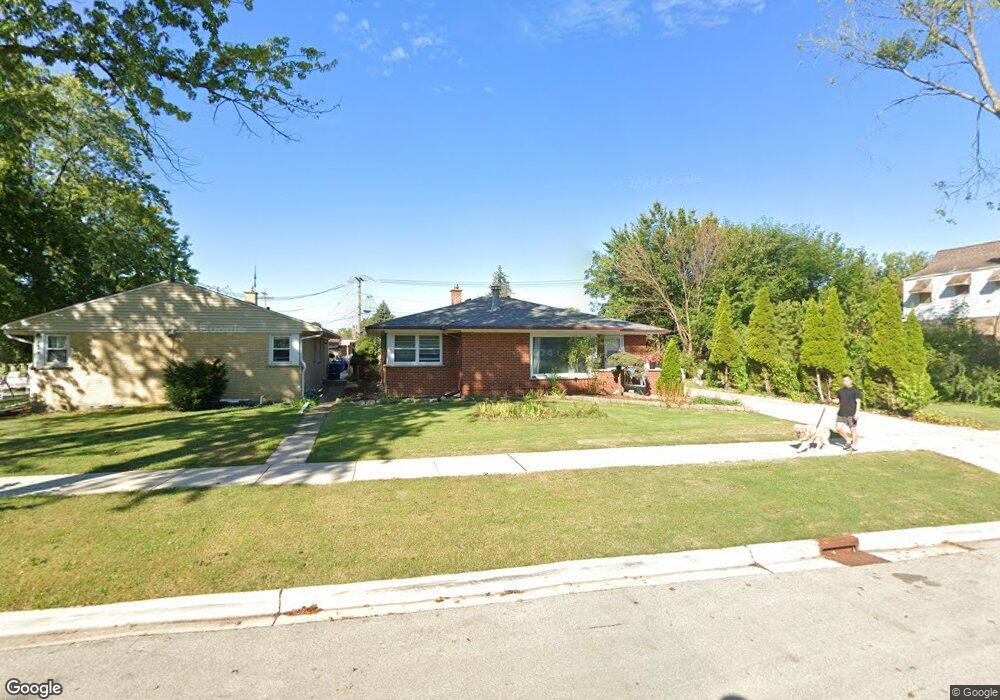
1886 Spruce Ave Des Plaines, IL 60018
Estimated Value: $347,000 - $429,000
3
Beds
1
Bath
1,110
Sq Ft
$358/Sq Ft
Est. Value
About This Home
This home is located at 1886 Spruce Ave, Des Plaines, IL 60018 and is currently estimated at $396,897, approximately $357 per square foot. 1886 Spruce Ave is a home located in Cook County with nearby schools including Plainfield Elementary School, Algonquin Middle School, and Maine West High School.
Ownership History
Date
Name
Owned For
Owner Type
Purchase Details
Closed on
Mar 12, 2007
Sold by
Ayala Salvador and Ayala Maria
Bought by
Ayala Maricela
Current Estimated Value
Purchase Details
Closed on
Apr 9, 2002
Sold by
Ayala Salvador and Ayala Salvador
Bought by
Ayala Salvador and Ayala Salvador
Home Financials for this Owner
Home Financials are based on the most recent Mortgage that was taken out on this home.
Original Mortgage
$173,600
Interest Rate
7.13%
Purchase Details
Closed on
Jun 2, 1999
Sold by
Fleckenstein Doris L
Bought by
Ayala Salvador and Ayala Salavador
Home Financials for this Owner
Home Financials are based on the most recent Mortgage that was taken out on this home.
Original Mortgage
$158,825
Interest Rate
7.43%
Mortgage Type
FHA
Create a Home Valuation Report for This Property
The Home Valuation Report is an in-depth analysis detailing your home's value as well as a comparison with similar homes in the area
Home Values in the Area
Average Home Value in this Area
Purchase History
We collect this data history from publicly available records. To have your information removed, we recommend requesting removal directly through your county’s website.
| Date | Buyer | Sale Price | Title Company |
|---|---|---|---|
| Ayala Maricela | -- | Multiple | |
| Ayala Salvador | -- | First American Title | |
| Ayala Salvador | $162,000 | -- | |
| Fleckenstein Doris L | -- | -- |
Source: Public Records
Mortgage History
We collect this data history from publicly available records. To have your information removed, we recommend requesting removal directly through your county’s website.
| Date | Status | Borrower | Loan Amount |
|---|---|---|---|
| Closed | Ayala Salvador | $173,600 | |
| Closed | Ayala Salvador | $158,825 |
Source: Public Records
Tax History
| Year | Tax Paid | Tax Assessment Tax Assessment Total Assessment is a certain percentage of the fair market value that is determined by local assessors to be the total taxable value of land and additions on the property. | Land | Improvement |
|---|---|---|---|---|
| 2025 | $2,792 | $35,000 | $6,200 | $28,800 |
| 2024 | $2,792 | $31,000 | $5,270 | $25,730 |
| 2023 | $2,811 | $31,000 | $5,270 | $25,730 |
| 2022 | $2,811 | $31,000 | $5,270 | $25,730 |
| 2021 | $3,065 | $16,631 | $4,340 | $12,291 |
| 2020 | $2,874 | $16,631 | $4,340 | $12,291 |
| 2019 | $2,829 | $18,687 | $4,340 | $14,347 |
| 2018 | $3,149 | $22,902 | $3,720 | $19,182 |
| 2017 | $3,039 | $22,902 | $3,720 | $19,182 |
| 2016 | $3,633 | $22,902 | $3,720 | $19,182 |
| 2015 | $4,037 | $17,852 | $3,255 | $14,597 |
| 2014 | $3,980 | $17,852 | $3,255 | $14,597 |
| 2013 | $5,115 | $20,356 | $3,255 | $17,101 |
Source: Public Records
Map
Nearby Homes
- 1857 Pine St
- 1678 Ash St
- 1830 Dexter Ln
- 2129 Ash St Unit G
- 1370 Fargo Ave Unit E
- 1541 Cooper St
- 1080 Bogart St
- 1030 Bogart St
- 805 S Tures Ln
- 1509 Center St
- 1693 Linden St
- 2124 Westview Dr
- 1458 Kingston Ct
- 794 E Lincoln Ave
- 616 Birchwood Ave
- 614 Birchwood Ave
- 1634 E Forest Ave
- 2232 Sprucewood Ave
- 1629 E Touhy Ave
- 2323 Douglas Ave
- 1874 Spruce Ave
- 1874 Spruce Ave
- 1896 Spruce Ave
- 1862 Spruce Ave
- 1879 Lee St
- 1887 Lee St
- 1871 Lee St
- 1854 Spruce Ave
- 1212 Prospect Ave
- 1863 Lee St
- 1863 Lee St
- 1846 Spruce Ave
- 1851 Lee St
- 1241 Prospect Ave
- 1241 Prospect Ave
- 1231 Prospect Ave
- 1223 Prospect Ave
- 1838 Spruce Ave
- 1843 Lee St
- 1255 Prospect Ave
Your Personal Tour Guide
Ask me questions while you tour the home.