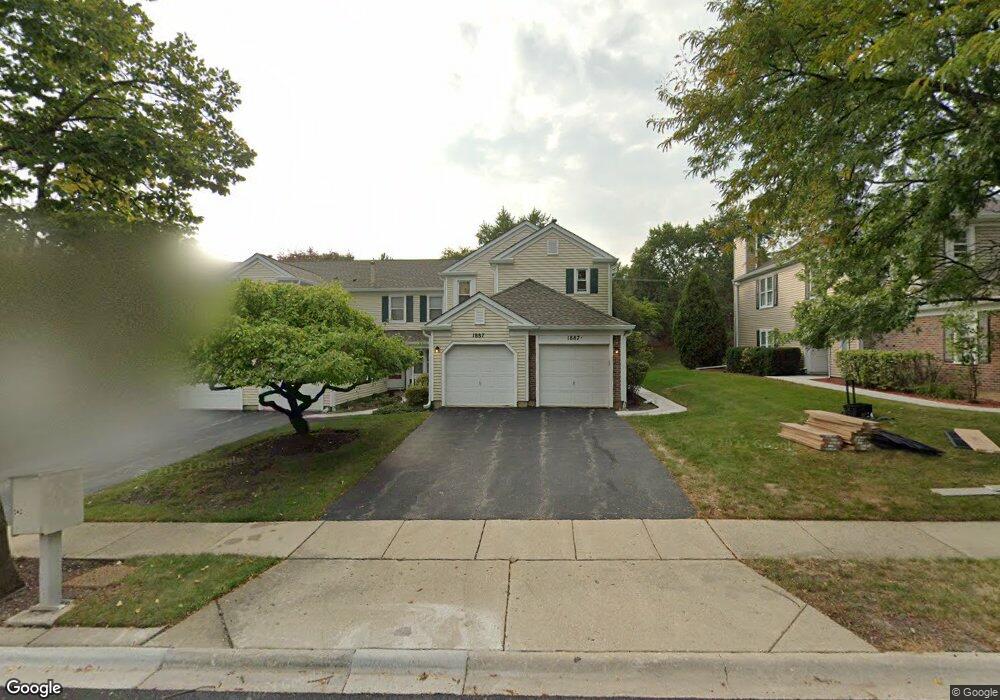
1887 Pebble Beach Cir Unit 22 Elk Grove Village, IL 60007
Elk Grove Village West NeighborhoodEstimated Value: $225,000 - $254,000
1
Bed
--
Bath
1,100
Sq Ft
$218/Sq Ft
Est. Value
About This Home
This home is located at 1887 Pebble Beach Cir Unit 22, Elk Grove Village, IL 60007 and is currently estimated at $239,484, approximately $217 per square foot. 1887 Pebble Beach Cir Unit 22 is a home located in Cook County with nearby schools including Michael Collins Elementary School, Margaret Mead Junior High School, and J B Conant High School.
Ownership History
Date
Name
Owned For
Owner Type
Purchase Details
Closed on
Feb 11, 2013
Sold by
Costa Sabrina and Costa John
Bought by
Zolecki Kimberly A
Current Estimated Value
Home Financials for this Owner
Home Financials are based on the most recent Mortgage that was taken out on this home.
Original Mortgage
$50,000
Outstanding Balance
$35,687
Interest Rate
3.87%
Mortgage Type
New Conventional
Estimated Equity
$203,797
Purchase Details
Closed on
Oct 16, 2006
Sold by
Beard Laura B
Bought by
Rafiqui Sabrina
Home Financials for this Owner
Home Financials are based on the most recent Mortgage that was taken out on this home.
Original Mortgage
$153,000
Interest Rate
8.94%
Mortgage Type
Balloon
Purchase Details
Closed on
Jun 27, 1997
Sold by
Rieder Andrea L
Bought by
Beard Laura B
Home Financials for this Owner
Home Financials are based on the most recent Mortgage that was taken out on this home.
Original Mortgage
$73,600
Interest Rate
8.01%
Create a Home Valuation Report for This Property
The Home Valuation Report is an in-depth analysis detailing your home's value as well as a comparison with similar homes in the area
Home Values in the Area
Average Home Value in this Area
Purchase History
| Date | Buyer | Sale Price | Title Company |
|---|---|---|---|
| Zolecki Kimberly A | $80,000 | None Available | |
| Rafiqui Sabrina | $170,000 | Attorneys Title Guaranty Fun | |
| Beard Laura B | $92,000 | Chicago Title Insurance Co |
Source: Public Records
Mortgage History
| Date | Status | Borrower | Loan Amount |
|---|---|---|---|
| Open | Zolecki Kimberly A | $50,000 | |
| Previous Owner | Rafiqui Sabrina | $153,000 | |
| Previous Owner | Beard Laura B | $73,600 |
Source: Public Records
Tax History Compared to Growth
Tax History
| Year | Tax Paid | Tax Assessment Tax Assessment Total Assessment is a certain percentage of the fair market value that is determined by local assessors to be the total taxable value of land and additions on the property. | Land | Improvement |
|---|---|---|---|---|
| 2024 | $4,557 | $15,717 | $3,933 | $11,784 |
| 2023 | $4,427 | $15,717 | $3,933 | $11,784 |
| 2022 | $4,427 | $15,717 | $3,933 | $11,784 |
| 2021 | $4,119 | $13,027 | $5,039 | $7,988 |
| 2020 | $4,016 | $13,027 | $5,039 | $7,988 |
| 2019 | $4,013 | $14,481 | $5,039 | $9,442 |
| 2018 | $3,539 | $11,426 | $4,240 | $7,186 |
| 2017 | $3,492 | $11,426 | $4,240 | $7,186 |
| 2016 | $3,432 | $12,030 | $4,240 | $7,790 |
| 2015 | $2,751 | $8,951 | $3,687 | $5,264 |
| 2014 | $2,712 | $8,951 | $3,687 | $5,264 |
| 2013 | $1,866 | $8,951 | $3,687 | $5,264 |
Source: Public Records
Map
Nearby Homes
- 722 Merlin Dr Unit 16
- 1871 Fox Run Dr Unit A
- 263 Doral Ct Unit 1
- 307 University Ln Unit A
- 1771 Vermont Dr
- 718 N Point Dr
- 421 Summit Dr
- 1221 Plum Tree Ct Unit 5481RD
- 373 Southbury Ct Unit D-1
- 1385 Scarboro Rd Unit 204
- 1264 Williamsburg Dr Unit D2
- 1386 Scarboro Rd Unit 1102
- 1910 Baltimore Dr
- 274 Buckingham Ct Unit D2
- 600 Eastview Ct Unit X1
- 602 Eastview Ct Unit Z1
- 665 Arizona Pass
- 1100 Boston Harbor Unit 7004
- 826 Thornton Ct Unit 2AL
- 1257 Rosewood Ct Unit D1
- 1887A Pebble Beach Cir Unit A
- 1887 Pebble Beach Cir Unit 22
- 1887 Pebble Beach Cir Unit A
- 1885 Pebble Beach Cir Unit 22
- 1883 Pebble Beach Cir Unit 22
- 1889 Pebble Beach Cir Unit 23
- 1889 Pebble Beach Cir Unit 23
- 1889 Pebble Beach Cir
- 1889 Pebble Beach Cir Unit A
- 1881 Pebble Beach Cir Unit A
- 1881 Pebble Beach Cir
- 1881 Pebble Beach Cir Unit 22
- 1881 Pebble Beach Cir Unit 22
- 1881 Pebble Beach Cir Unit 1
- 1891 Pebble Beach Cir Unit 23
- 1893 Pebble Beach Cir Unit 23
- 1895 Pebble Beach Cir Unit 23
- 1879 Pebble Beach Cir Unit 21
- 1879 Pebble Beach Cir Unit 21
- 1879 Pebble Beach Cir Unit A