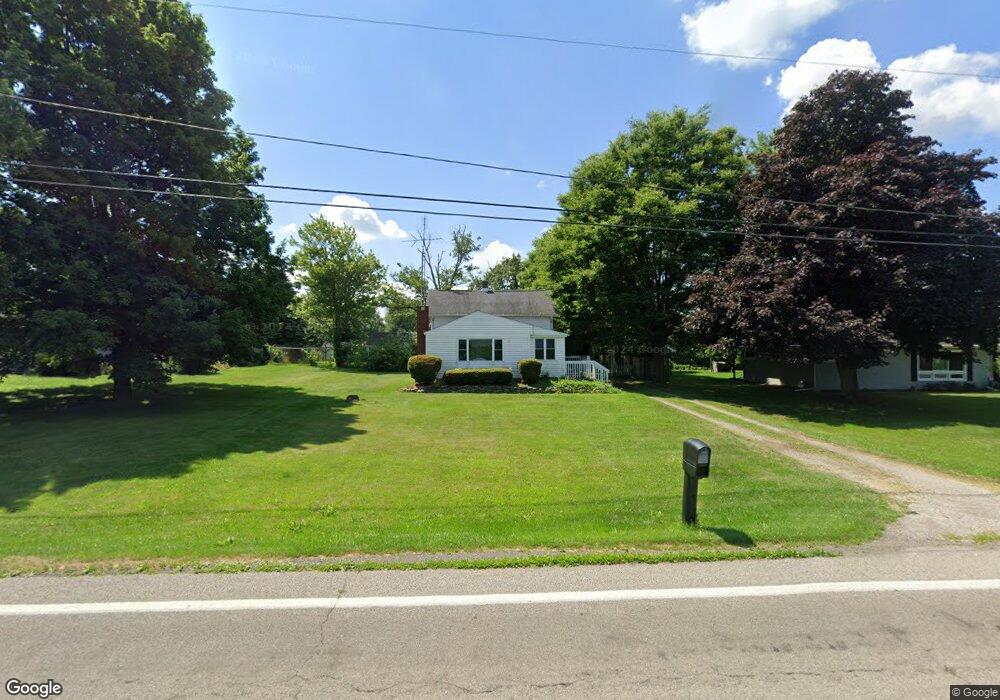
18871 St Rt 2 Wauseon, OH 43567
Estimated Value: $118,000 - $143,000
3
Beds
1
Bath
1,086
Sq Ft
$121/Sq Ft
Est. Value
About This Home
This home is located at 18871 St Rt 2, Wauseon, OH 43567 and is currently estimated at $131,671, approximately $121 per square foot. 18871 St Rt 2 is a home located in Fulton County with nearby schools including Pettisville Elementary School, Pettisville High School, and New Horizons Academy at Sara's Garden.
Ownership History
Date
Name
Owned For
Owner Type
Purchase Details
Closed on
Oct 6, 2009
Sold by
Federal Home Loan Mortgage Corporation
Bought by
Burkholder Steven L
Current Estimated Value
Purchase Details
Closed on
May 22, 2009
Sold by
Tripp Vicki L
Bought by
Federal Home Loan Mortgage Corp
Purchase Details
Closed on
Aug 25, 2004
Sold by
Hartzell Julie A
Bought by
Tripp Vicki L
Purchase Details
Closed on
Jul 10, 2003
Sold by
Tripp Vicki L
Bought by
Tripp Vicki L and Hartzell Julie A
Purchase Details
Closed on
Sep 4, 2001
Sold by
Moon Erik A
Bought by
Tripp Vicki L
Home Financials for this Owner
Home Financials are based on the most recent Mortgage that was taken out on this home.
Original Mortgage
$91,550
Interest Rate
7.11%
Mortgage Type
FHA
Purchase Details
Closed on
Jan 1, 1990
Bought by
Moon Erik A and Moon Miki L
Create a Home Valuation Report for This Property
The Home Valuation Report is an in-depth analysis detailing your home's value as well as a comparison with similar homes in the area
Home Values in the Area
Average Home Value in this Area
Purchase History
| Date | Buyer | Sale Price | Title Company |
|---|---|---|---|
| Burkholder Steven L | $41,000 | Attorney | |
| Federal Home Loan Mortgage Corp | $53,333 | None Available | |
| Tripp Vicki L | $3,000 | -- | |
| Tripp Vicki L | -- | -- | |
| Tripp Vicki L | $93,000 | -- | |
| Moon Erik A | -- | -- |
Source: Public Records
Mortgage History
| Date | Status | Borrower | Loan Amount |
|---|---|---|---|
| Previous Owner | Tripp Vicki L | $91,550 |
Source: Public Records
Tax History Compared to Growth
Tax History
| Year | Tax Paid | Tax Assessment Tax Assessment Total Assessment is a certain percentage of the fair market value that is determined by local assessors to be the total taxable value of land and additions on the property. | Land | Improvement |
|---|---|---|---|---|
| 2024 | $1,333 | $27,690 | $7,000 | $20,690 |
| 2023 | $1,483 | $27,690 | $7,000 | $20,690 |
| 2022 | $1,499 | $23,840 | $5,850 | $17,990 |
| 2021 | $1,531 | $23,840 | $5,850 | $17,990 |
| 2020 | $1,557 | $23,840 | $5,850 | $17,990 |
| 2019 | $1,424 | $21,110 | $5,850 | $15,260 |
| 2018 | $694 | $21,110 | $5,850 | $15,260 |
| 2017 | $1,358 | $21,110 | $5,850 | $15,260 |
| 2016 | $1,266 | $19,710 | $5,850 | $13,860 |
| 2015 | $1,149 | $19,710 | $5,850 | $13,860 |
| 2014 | $1,082 | $19,710 | $5,850 | $13,860 |
| 2013 | $1,199 | $20,060 | $5,710 | $14,350 |
Source: Public Records
Map
Nearby Homes
- 4427 County Road 19
- 17020 State Route 2
- 2820 County Road 19
- 16020 County Road D
- 15819 County Road D
- 804 Murbach St
- 744 Fairway Dr Unit 30
- 221 Farmington Rd
- 16396 County Road H
- 749 Parkside Dr
- 411 Clover Ln
- 604 W Leggett St
- 448 Dwight Ave
- 420 Clover Ln
- 703 N Defiance St
- 208 N Brunell St
- 263 W Chestnut St
- 234 W Chestnut St
- 227 Wabash St
- 433 Primrose Ln
- 18871 State Route 2
- 18851 State Route 2
- 18889 State Route 2
- 4986 Co Rd 19
- 4986 County Road 19
- 18811 State Route 2
- 0 Co Rd 19 Unit 5087159
- 18789 State Route 2
- 18789 St Rt 2
- 4902 County Road 19
- 4902 County Road 19
- 4987 County Road 19
- 18767 State Route 2
- 18767 Ohio 2
- 5037 County Road 19
- 4925 County Road 19
- 4915 County Road 19
- 4856 County Road 19
- 5069 County Road 19
- 4895 Co Rd 19