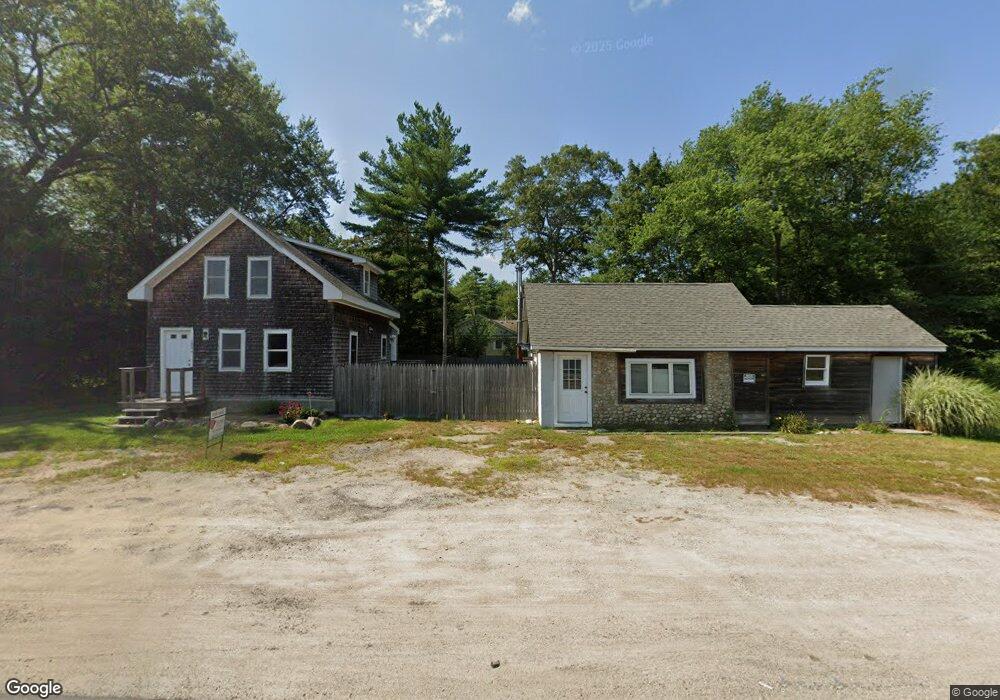
188B Danielson Pike Foster, RI 02825
Estimated Value: $497,000 - $536,000
3
Beds
2
Baths
1,628
Sq Ft
$317/Sq Ft
Est. Value
About This Home
This home is located at 188B Danielson Pike, Foster, RI 02825 and is currently estimated at $516,332, approximately $317 per square foot. 188B Danielson Pike is a home located in Providence County with nearby schools including Capt. Isaac Paine El. School, Ponaganset Middle School, and Ponaganset High School.
Ownership History
Date
Name
Owned For
Owner Type
Purchase Details
Closed on
Oct 29, 2018
Sold by
Skinner Shane A and Skinner Stephanie L
Bought by
Simoes Henrique J and Simoes Kathryn C
Current Estimated Value
Home Financials for this Owner
Home Financials are based on the most recent Mortgage that was taken out on this home.
Original Mortgage
$224,000
Outstanding Balance
$196,153
Interest Rate
4.6%
Mortgage Type
Unknown
Estimated Equity
$320,179
Purchase Details
Closed on
Nov 2, 2017
Sold by
Soucie Ft and Soucie Donald
Bought by
Skinner Shane A and Skinner Stephanie L
Home Financials for this Owner
Home Financials are based on the most recent Mortgage that was taken out on this home.
Original Mortgage
$267,547
Interest Rate
3.83%
Mortgage Type
FHA
Purchase Details
Closed on
Oct 27, 1995
Sold by
Bussius Michael J
Bought by
Glanville Alfred A and Glanville Digna
Home Financials for this Owner
Home Financials are based on the most recent Mortgage that was taken out on this home.
Original Mortgage
$86,963
Interest Rate
7.6%
Create a Home Valuation Report for This Property
The Home Valuation Report is an in-depth analysis detailing your home's value as well as a comparison with similar homes in the area
Home Values in the Area
Average Home Value in this Area
Purchase History
| Date | Buyer | Sale Price | Title Company |
|---|---|---|---|
| Simoes Henrique J | $280,000 | -- | |
| Skinner Shane A | $259,000 | -- | |
| Glanville Alfred A | $89,000 | -- |
Source: Public Records
Mortgage History
| Date | Status | Borrower | Loan Amount |
|---|---|---|---|
| Open | Glanville Alfred A | $224,000 | |
| Previous Owner | Glanville Alfred A | $267,547 | |
| Previous Owner | Glanville Alfred A | $80,000 | |
| Previous Owner | Glanville Alfred A | $86,963 |
Source: Public Records
Tax History Compared to Growth
Tax History
| Year | Tax Paid | Tax Assessment Tax Assessment Total Assessment is a certain percentage of the fair market value that is determined by local assessors to be the total taxable value of land and additions on the property. | Land | Improvement |
|---|---|---|---|---|
| 2024 | $8,045 | $386,200 | $92,400 | $293,800 |
| 2023 | $6,567 | $289,700 | $71,100 | $218,600 |
| 2022 | $6,362 | $289,700 | $71,100 | $218,600 |
| 2021 | $6,182 | $289,700 | $71,100 | $218,600 |
| 2020 | $5,788 | $243,300 | $61,800 | $181,500 |
| 2018 | $5,557 | $243,300 | $61,800 | $181,500 |
| 2017 | $4,920 | $211,600 | $61,800 | $149,800 |
| 2015 | $4,532 | $211,600 | $61,800 | $149,800 |
| 2014 | $4,370 | $207,500 | $62,100 | $145,400 |
Source: Public Records
Map
Nearby Homes
- 188 Danielson Pike
- 8 Boswell Trail
- 152 Danielson Pike
- 395 Bailey Hill Rd
- 365 Cranberry Bog Rd
- 498 Bailey Hill Rd
- 79 Cucumber Hill Rd
- 119 E Killingly Rd
- 105 S Killingly Rd
- 679 Bailey Hill Rd
- 9 Colleen St
- 99 Snake Meadow Rd
- 330 Cook Hill Rd
- 129 Snake Meadow Rd
- 16 Burgess Rd
- 612 Cook Hill Rd
- 6 North Rd
- 872 Bailey Hill Rd
- 564 Hubbard Rd
- 175 Mashentuck Rd
- 188B Danielson Pike Unit B
- 188A Danielson Pike
- 188 Danielson Pike Unit A
- 188B Danielson Pike Unit B
- 186 Danielson Pike
- 189 Danielson Pike
- 190 Danielson Pike
- 185 Danielson Pike
- 44 Shippee Schoolhouse Rd
- 41 Shippee Schoolhouse Rd
- 46 Shippee Schoolhouse Rd
- 43 Shippee Schoolhouse Rd
- 183 Danielson Pike
- 40 Shippee Schoolhouse Rd
- 195 Danielson Pike
- 31 Shippee School House Rd
- 61 Shippee Schoolhouse Rd Rd
- 535 Shippee School House Rd
- 45 Shippee School House Rd
- 1198 Providence Pike