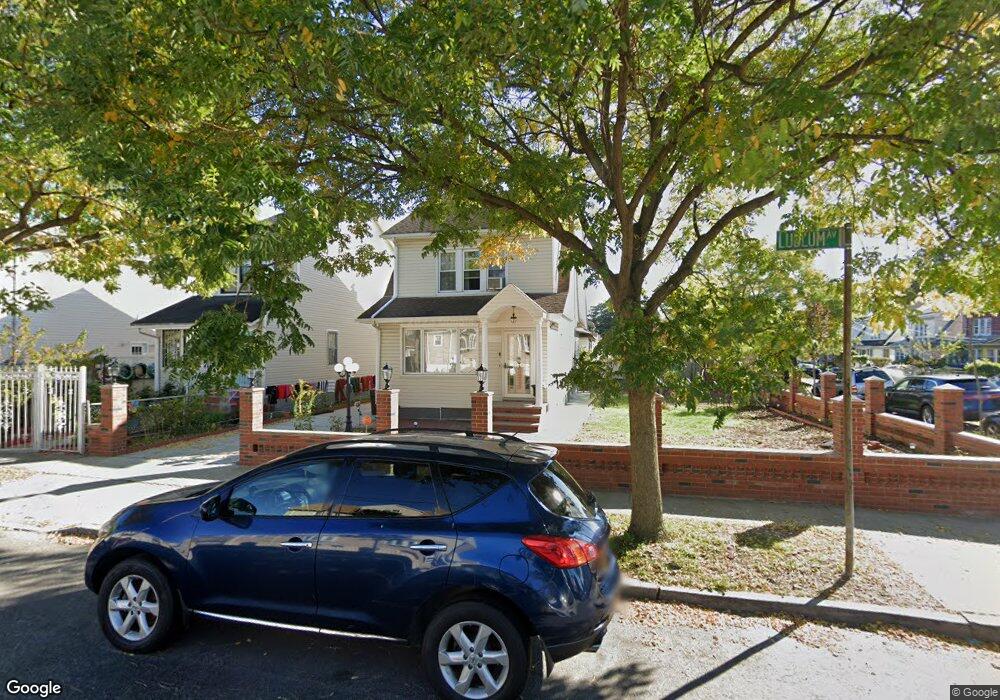
189-02 Ludlum Ave Saint Albans, NY 11412
Hollis NeighborhoodEstimated Value: $822,000 - $1,004,000
4
Beds
3
Baths
2,500
Sq Ft
$366/Sq Ft
Est. Value
About This Home
This home is located at 189-02 Ludlum Ave, Saint Albans, NY 11412 and is currently estimated at $914,570, approximately $365 per square foot. 189-02 Ludlum Ave is a home located in Queens County with nearby schools including P.S. 118 Lorraine Hansberry, I.S. 192 The Linden, and Wellspring Elementary & Middle.
Ownership History
Date
Name
Owned For
Owner Type
Purchase Details
Closed on
Nov 16, 2017
Sold by
S & R Property Holdings Group Llc
Bought by
Ahmed Babul and Akhter Nazma
Current Estimated Value
Home Financials for this Owner
Home Financials are based on the most recent Mortgage that was taken out on this home.
Original Mortgage
$488,000
Outstanding Balance
$409,244
Interest Rate
3.88%
Mortgage Type
New Conventional
Estimated Equity
$505,326
Purchase Details
Closed on
May 8, 2017
Sold by
Vaughan Dawn and Vaughan Gerald
Bought by
S & R Property Holdings Group Llc
Purchase Details
Closed on
Oct 20, 2006
Sold by
Incorrectly Acquired Vaughn Dawn and Incorrectly Acquired Vaughn
Bought by
Vaughan Dawn and Vaughan Gerald
Purchase Details
Closed on
Dec 15, 2004
Sold by
Manson Robert Lee and Mccoll Charmaine
Bought by
Vaughn Dawn and Vaughn Gerald
Create a Home Valuation Report for This Property
The Home Valuation Report is an in-depth analysis detailing your home's value as well as a comparison with similar homes in the area
Home Values in the Area
Average Home Value in this Area
Purchase History
| Date | Buyer | Sale Price | Title Company |
|---|---|---|---|
| Ahmed Babul | $610,000 | -- | |
| Ahmed Babul | $610,000 | -- | |
| S & R Property Holdings Group Llc | $290,000 | -- | |
| S & R Property Holdings Group Llc | $290,000 | -- | |
| Vaughan Dawn | -- | -- | |
| Vaughan Dawn | -- | -- | |
| Vaughn Dawn | -- | -- | |
| Vaughn Dawn | -- | -- |
Source: Public Records
Mortgage History
| Date | Status | Borrower | Loan Amount |
|---|---|---|---|
| Open | Ahmed Babul | $488,000 | |
| Closed | Ahmed Babul | $488,000 | |
| Closed | Vaughan Dawn | $0 |
Source: Public Records
Tax History Compared to Growth
Tax History
| Year | Tax Paid | Tax Assessment Tax Assessment Total Assessment is a certain percentage of the fair market value that is determined by local assessors to be the total taxable value of land and additions on the property. | Land | Improvement |
|---|---|---|---|---|
| 2025 | $6,277 | $33,126 | $9,763 | $23,363 |
| 2024 | $6,277 | $31,252 | $10,824 | $20,428 |
| 2023 | $6,037 | $30,058 | $9,218 | $20,840 |
| 2022 | $6,000 | $49,260 | $15,420 | $33,840 |
| 2021 | $6,157 | $41,280 | $15,420 | $25,860 |
| 2020 | $5,843 | $41,040 | $15,420 | $25,620 |
| 2019 | $5,448 | $38,100 | $15,420 | $22,680 |
| 2018 | $5,106 | $25,048 | $10,501 | $14,547 |
| 2017 | $3,854 | $25,048 | $11,987 | $13,061 |
| 2016 | $4,874 | $25,048 | $11,987 | $13,061 |
| 2015 | $2,850 | $23,004 | $13,112 | $9,892 |
| 2014 | $2,850 | $21,703 | $13,837 | $7,866 |
Source: Public Records
Map
Nearby Homes
- 10533 Farmers Blvd
- 19027 109th Rd
- 187-23 Brinkerhoff Ave
- 102-35 187th St
- 10532 192nd St
- 190-30 103rd Ave
- 10220 189th St
- 10211 187th St
- 193-21 109th Rd
- 104-40 194th St
- 19319 109th Rd
- 194-10 Hollis Ave
- 185-05 Henderson Ave
- 111-06 Farmers Blvd
- 184-15 Henderson Ave
- 102-13 183rd Place
- 183-29 Brinkerhoff Ave
- 183-09 Dunlop Ave
- 186-16 Hilburn Ave
- 183-12 Elmira Ave
- 18820 Ludlum Ave
- 18902 Ludlum Ave
- 18816 Ludlum Ave
- 18816 Ludlum Ave
- 18906 Ludlum Ave
- 10511 189th St
- 10512 189th St
- 10512 189th St
- 188-12 Ludlum Ave
- 18812 Ludlum Ave
- 18910 Ludlum Ave
- 188-19 Ludlum Ave Unit Room 2
- 188-19 Ludlum Ave Unit Room 1
- 10429 189th St
- 18910 Ludlum Ave
- 10513 189th St
- 18819 Ludlum Ave
- 10514 189th St
- 188-15 Ludlum Ave
- 188-15 Ludlum Ave Unit 2