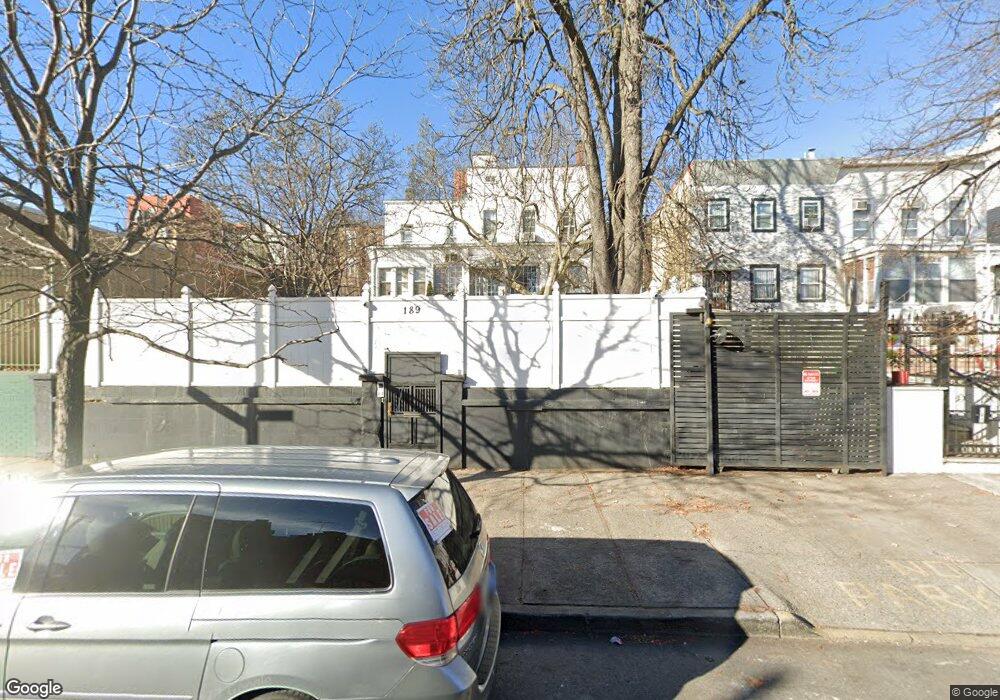
189-191 Jamaica Ave Brooklyn, NY 11207
Cypress Hills NeighborhoodEstimated Value: $1,023,000 - $1,159,290
--
Bed
--
Bath
2,450
Sq Ft
$440/Sq Ft
Est. Value
About This Home
This home is located at 189-191 Jamaica Ave, Brooklyn, NY 11207 and is currently estimated at $1,077,573, approximately $439 per square foot. 189-191 Jamaica Ave is a home located in Kings County with nearby schools including P.S. 290 - Juan Morel Campos, Liberty Avenue Middle School, and Vista Academy.
Ownership History
Date
Name
Owned For
Owner Type
Purchase Details
Closed on
Jan 31, 2019
Sold by
Ferreira Juana
Bought by
Bonilla Veronica and Ferreira Andres A
Current Estimated Value
Home Financials for this Owner
Home Financials are based on the most recent Mortgage that was taken out on this home.
Original Mortgage
$499,846
Outstanding Balance
$436,488
Interest Rate
4.37%
Mortgage Type
FHA
Estimated Equity
$641,085
Purchase Details
Closed on
Apr 13, 2005
Sold by
Alies Natividad and Pereyra Wendy
Bought by
Ferreira Juana
Home Financials for this Owner
Home Financials are based on the most recent Mortgage that was taken out on this home.
Original Mortgage
$422,900
Interest Rate
5.95%
Mortgage Type
Purchase Money Mortgage
Purchase Details
Closed on
Dec 12, 2003
Sold by
Stefani Francisco
Bought by
Pereyra Wendy
Create a Home Valuation Report for This Property
The Home Valuation Report is an in-depth analysis detailing your home's value as well as a comparison with similar homes in the area
Home Values in the Area
Average Home Value in this Area
Purchase History
| Date | Buyer | Sale Price | Title Company |
|---|---|---|---|
| Bonilla Veronica | -- | -- | |
| Bonilla Veronica | -- | -- | |
| Bonilla Veronica | -- | -- | |
| Ferreira Juana | $432,600 | -- | |
| Ferreira Juana | $432,600 | -- | |
| Pereyra Wendy | -- | -- | |
| Pereyra Wendy | -- | -- |
Source: Public Records
Mortgage History
| Date | Status | Borrower | Loan Amount |
|---|---|---|---|
| Open | Bonilla Veronica | $499,846 | |
| Closed | Bonilla Veronica | $499,846 | |
| Previous Owner | Ferreira Juana | $422,900 |
Source: Public Records
Tax History Compared to Growth
Tax History
| Year | Tax Paid | Tax Assessment Tax Assessment Total Assessment is a certain percentage of the fair market value that is determined by local assessors to be the total taxable value of land and additions on the property. | Land | Improvement |
|---|---|---|---|---|
| 2025 | $4,483 | $78,240 | $25,620 | $52,620 |
| 2024 | $4,483 | $65,460 | $25,620 | $39,840 |
| 2023 | $1,976 | $64,920 | $25,620 | $39,300 |
| 2022 | $1,666 | $71,160 | $25,620 | $45,540 |
| 2021 | $1,882 | $62,340 | $25,620 | $36,720 |
| 2020 | $2,061 | $42,600 | $25,620 | $16,980 |
| 2019 | $3,891 | $42,600 | $25,620 | $16,980 |
| 2018 | $3,579 | $17,556 | $9,903 | $7,653 |
| 2017 | $3,378 | $16,570 | $8,628 | $7,942 |
| 2016 | $3,312 | $16,570 | $10,656 | $5,914 |
| 2015 | $1,885 | $16,420 | $10,236 | $6,184 |
| 2014 | $1,885 | $15,501 | $9,566 | $5,935 |
Source: Public Records
Map
Nearby Homes
- 178 Highland Blvd
- 153 Highland Blvd
- 4 Crosby Ave
- 14 van Siclen Ct
- 224 Highland Blvd Unit 710
- 52 Bradford St
- 48 van Siclen Ave
- 52 van Siclen Ave
- 107 Miller Ave
- 57 Wyona St
- 133 Sunnyside Ave
- 90 Jackie Robinson Pkwy
- 57 Bulwer Place
- 3 Schenck Ct
- 90 Wyona St
- 153 Hendrix St
- 168 Miller Ave
- 87 Schenck Ave
- 2830 Fulton St
- 171 Arlington Ave
- 189 Jamaica Ave Unit 191
- 193 Jamaica Ave
- 195 Jamaica Ave
- 179 Jamaica Ave
- 197 Jamaica Ave
- 173 Jamaica Ave
- 52 Sunnyside Ave
- 58 Sunnyside Ave
- 50 Sunnyside Ave
- 50 Sunnyside Ave Unit 1Fl
- 48 Sunnyside Ave
- 171 Jamaica Ave
- 60 Sunnyside Ave
- 160 Jamaica Ave
- 205 Jamaica Ave
- 64 Sunnyside Ave
- 46 Sunnyside Ave
- 162 Jamaica Ave
- 164 Jamaica Ave
- 166 Jamaica Ave