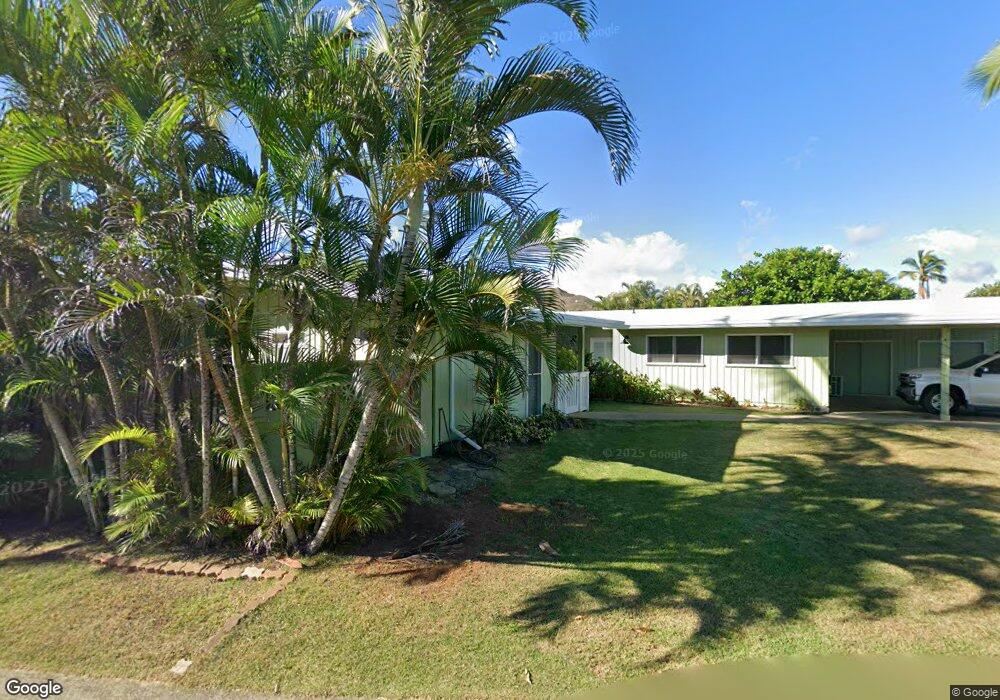
189 Aikahi Loop Kailua, HI 96734
Estimated Value: $1,692,000 - $1,934,591
3
Beds
3
Baths
2,106
Sq Ft
$866/Sq Ft
Est. Value
About This Home
This home is located at 189 Aikahi Loop, Kailua, HI 96734 and is currently estimated at $1,822,898, approximately $865 per square foot. 189 Aikahi Loop is a home located in Honolulu County with nearby schools including Aikahi Elementary School, Kailua Intermediate School, and Kalaheo High School.
Ownership History
Date
Name
Owned For
Owner Type
Purchase Details
Closed on
Dec 2, 2016
Sold by
Salmonson Eric John and Salmonson Jodi Christine
Bought by
Samonson Eric John and Salmonson Jodi Christine
Current Estimated Value
Home Financials for this Owner
Home Financials are based on the most recent Mortgage that was taken out on this home.
Original Mortgage
$617,000
Outstanding Balance
$497,445
Interest Rate
3.47%
Mortgage Type
New Conventional
Estimated Equity
$1,325,453
Purchase Details
Closed on
Aug 1, 2002
Sold by
Morris Deborah Misajon
Bought by
Salmonson Eric John and Salmonson Jodi Christine
Home Financials for this Owner
Home Financials are based on the most recent Mortgage that was taken out on this home.
Original Mortgage
$380,000
Interest Rate
6.6%
Purchase Details
Closed on
Jul 24, 2001
Sold by
Wong Ashiang and Wong Heidi Dick
Bought by
Kelliher Deborah Chi
Home Financials for this Owner
Home Financials are based on the most recent Mortgage that was taken out on this home.
Original Mortgage
$341,600
Interest Rate
7.15%
Create a Home Valuation Report for This Property
The Home Valuation Report is an in-depth analysis detailing your home's value as well as a comparison with similar homes in the area
Home Values in the Area
Average Home Value in this Area
Purchase History
| Date | Buyer | Sale Price | Title Company |
|---|---|---|---|
| Samonson Eric John | -- | Fidelity Natl Title & Escrow | |
| Samonson Eric John | -- | Fidelity Natl Title & Escrow | |
| Salmonson Eric John | $475,000 | -- | |
| Kelliher Deborah Chi | $427,000 | -- |
Source: Public Records
Mortgage History
| Date | Status | Borrower | Loan Amount |
|---|---|---|---|
| Open | Samonson Eric John | $617,000 | |
| Closed | Samonson Eric John | $617,000 | |
| Closed | Salmonson Eric John | $380,000 | |
| Previous Owner | Kelliher Deborah Chi | $341,600 |
Source: Public Records
Tax History
| Year | Tax Paid | Tax Assessment Tax Assessment Total Assessment is a certain percentage of the fair market value that is determined by local assessors to be the total taxable value of land and additions on the property. | Land | Improvement |
|---|---|---|---|---|
| 2025 | $5,862 | $1,698,500 | $1,298,400 | $400,100 |
| 2024 | $5,862 | $1,794,900 | $1,298,400 | $496,500 |
| 2023 | $6,229 | $1,979,700 | $1,298,400 | $681,300 |
| 2022 | $5,302 | $1,614,900 | $1,222,000 | $392,900 |
| 2021 | $4,615 | $1,418,600 | $1,008,200 | $410,400 |
| 2020 | $4,232 | $1,309,000 | $992,900 | $316,100 |
| 2019 | $4,256 | $1,296,100 | $977,600 | $318,500 |
| 2018 | $4,225 | $1,287,200 | $977,600 | $309,600 |
| 2017 | $4,130 | $1,260,100 | $855,400 | $404,700 |
| 2016 | $7,214 | $1,202,300 | $794,300 | $408,000 |
| 2015 | $6,581 | $1,096,800 | $687,400 | $409,400 |
| 2014 | $2,926 | $814,000 | $656,800 | $157,200 |
Source: Public Records
Map
Nearby Homes
- 225 Aikane St
- 676 Mokapu Rd
- 610 Milokai St
- 592 Kaimalino St
- 304 Ilimano St
- 3182 Kuau St Unit 702
- 316 Molo St Unit 1803
- 137 Oko St Unit 901
- 183 Oko St Unit 2604
- 824 N Kalaheo Ave Unit A
- 1110 Ilikala Place
- 1251 Kainui Dr
- 44-365 Nilu St Unit 109
- 44-361 Nilu St Unit 6
- 44-350 Olina St Unit 34
- 572 C N Kalaheo Ave
- 661 N Kainalu Dr
- 508 N Kalaheo Ave
- 32 Pilipu Place Unit A
- 49 Pilipu Place
- 181 Aikahi Loop
- 195 Aikahi Loop
- 5 Aimikana St
- 188 Aikahi Loop
- 179 Aikahi Loop
- 194 Aikahi Loop
- 192 Aikahi Loop
- 184 Aikahi Loop
- 182 Aikahi Loop
- 196 Aikahi Loop
- 186 Aikahi Loop
- 180 Aikahi Loop
- 175 Aikahi Loop
- 11 Aimikana St
- 203 Aikahi Loop
- 198 Aikahi Loop
- 190 Aikahi Loop
- 663 Mokapu Rd
- 659 Mokapu Rd
- 176 Aikahi Loop
Your Personal Tour Guide
Ask me questions while you tour the home.