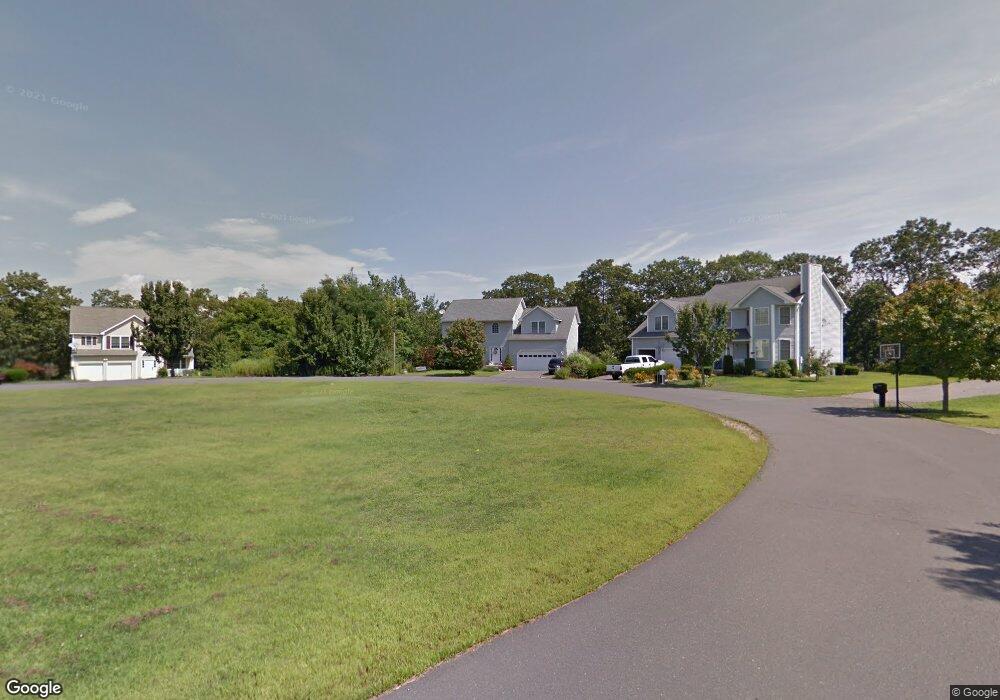
189 Auburn St Naugatuck, CT 06770
Estimated Value: $433,000 - $490,000
3
Beds
3
Baths
2,041
Sq Ft
$226/Sq Ft
Est. Value
About This Home
This home is located at 189 Auburn St, Naugatuck, CT 06770 and is currently estimated at $461,787, approximately $226 per square foot. 189 Auburn St is a home located in New Haven County with nearby schools including City Hill Middle School and Naugatuck High School.
Ownership History
Date
Name
Owned For
Owner Type
Purchase Details
Closed on
Oct 31, 2005
Sold by
B & G Contr Llc
Bought by
Pinto Steven R and Pinto Sara
Current Estimated Value
Home Financials for this Owner
Home Financials are based on the most recent Mortgage that was taken out on this home.
Original Mortgage
$301,500
Interest Rate
5.79%
Mortgage Type
Purchase Money Mortgage
Create a Home Valuation Report for This Property
The Home Valuation Report is an in-depth analysis detailing your home's value as well as a comparison with similar homes in the area
Home Values in the Area
Average Home Value in this Area
Purchase History
| Date | Buyer | Sale Price | Title Company |
|---|---|---|---|
| Pinto Steven R | $335,000 | -- |
Source: Public Records
Mortgage History
| Date | Status | Borrower | Loan Amount |
|---|---|---|---|
| Open | Pinto Steven R | $364,630 | |
| Closed | Pinto Steven R | $290,605 | |
| Closed | Pinto Steven R | $301,500 |
Source: Public Records
Tax History Compared to Growth
Tax History
| Year | Tax Paid | Tax Assessment Tax Assessment Total Assessment is a certain percentage of the fair market value that is determined by local assessors to be the total taxable value of land and additions on the property. | Land | Improvement |
|---|---|---|---|---|
| 2025 | $9,537 | $239,680 | $34,580 | $205,100 |
| 2024 | $10,016 | $239,680 | $34,580 | $205,100 |
| 2023 | $10,726 | $239,680 | $34,580 | $205,100 |
| 2022 | $8,065 | $168,900 | $36,300 | $132,600 |
| 2021 | $8,065 | $168,900 | $36,300 | $132,600 |
| 2020 | $8,065 | $168,900 | $36,300 | $132,600 |
| 2019 | $7,981 | $168,900 | $36,300 | $132,600 |
| 2018 | $8,060 | $166,710 | $51,160 | $115,550 |
| 2017 | $8,094 | $166,710 | $51,160 | $115,550 |
| 2016 | $7,931 | $166,370 | $50,820 | $115,550 |
| 2015 | $7,581 | $166,370 | $50,820 | $115,550 |
| 2014 | $7,497 | $166,370 | $50,820 | $115,550 |
| 2012 | $7,460 | $222,350 | $52,730 | $169,620 |
Source: Public Records
Map
Nearby Homes