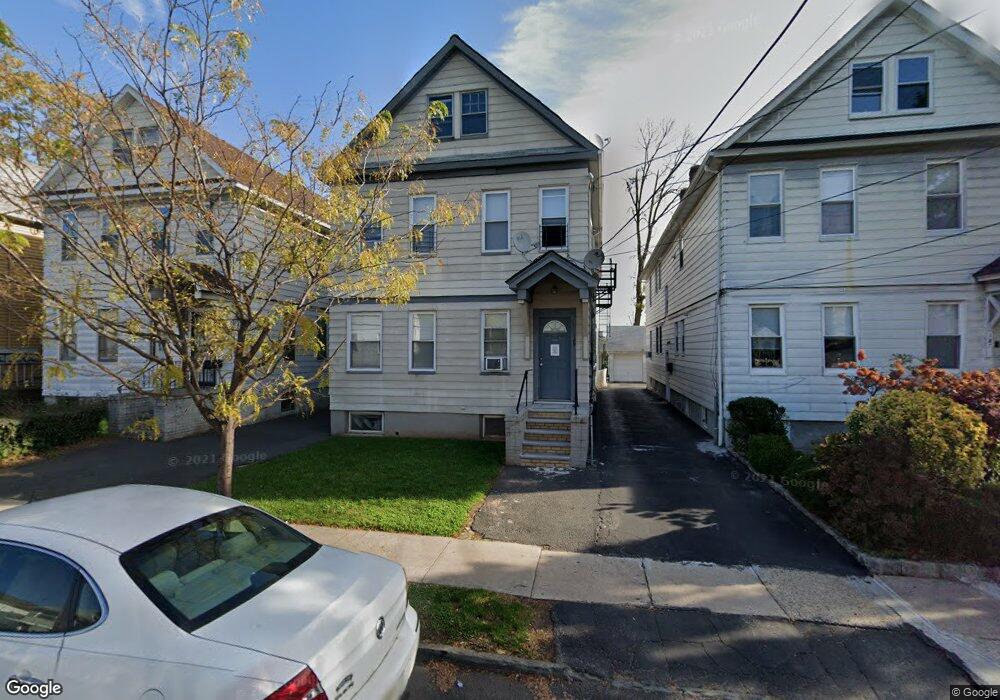
189 Bellevue St Unit 2F Elizabeth, NJ 07202
Elmora NeighborhoodEstimated Value: $828,000 - $899,000
2
Beds
1
Bath
3,484
Sq Ft
$244/Sq Ft
Est. Value
About This Home
This home is located at 189 Bellevue St Unit 2F, Elizabeth, NJ 07202 and is currently estimated at $849,469, approximately $243 per square foot. 189 Bellevue St Unit 2F is a home located in Union County with nearby schools including Number 14, Abraham Lincoln Elementary School, Elizabeth High School, and Jewish Educational Center Lower School.
Ownership History
Date
Name
Owned For
Owner Type
Purchase Details
Closed on
Dec 1, 2021
Sold by
Otero Robert M
Bought by
Rodriguez Frank
Current Estimated Value
Home Financials for this Owner
Home Financials are based on the most recent Mortgage that was taken out on this home.
Original Mortgage
$480,000
Outstanding Balance
$441,651
Interest Rate
3.14%
Mortgage Type
New Conventional
Estimated Equity
$407,818
Purchase Details
Closed on
Jul 25, 2002
Sold by
Kulig Richard
Bought by
Oero Robert
Home Financials for this Owner
Home Financials are based on the most recent Mortgage that was taken out on this home.
Original Mortgage
$2,425,250
Interest Rate
6.64%
Purchase Details
Closed on
Jan 26, 2001
Sold by
Kulig Richard S and Kulig Teresa D
Bought by
Kulig Richard S
Create a Home Valuation Report for This Property
The Home Valuation Report is an in-depth analysis detailing your home's value as well as a comparison with similar homes in the area
Home Values in the Area
Average Home Value in this Area
Purchase History
| Date | Buyer | Sale Price | Title Company |
|---|---|---|---|
| Rodriguez Frank | $640,000 | Transparent Ttl & Stlmt Llc | |
| Oero Robert | $285,000 | -- | |
| Kulig Richard S | -- | -- |
Source: Public Records
Mortgage History
| Date | Status | Borrower | Loan Amount |
|---|---|---|---|
| Open | Rodriguez Frank | $480,000 | |
| Previous Owner | Oero Robert | $2,425,250 |
Source: Public Records
Tax History Compared to Growth
Tax History
| Year | Tax Paid | Tax Assessment Tax Assessment Total Assessment is a certain percentage of the fair market value that is determined by local assessors to be the total taxable value of land and additions on the property. | Land | Improvement |
|---|---|---|---|---|
| 2025 | $12,979 | $674,600 | $206,500 | $468,100 |
| 2024 | $13,295 | $674,600 | $206,500 | $468,100 |
| 2023 | $13,295 | $42,300 | $8,700 | $33,600 |
| 2022 | $12,935 | $42,300 | $8,700 | $33,600 |
| 2021 | $12,668 | $42,300 | $8,700 | $33,600 |
| 2020 | $12,382 | $42,300 | $8,700 | $33,600 |
| 2019 | $12,193 | $42,300 | $8,700 | $33,600 |
| 2018 | $12,074 | $42,300 | $8,700 | $33,600 |
| 2017 | $11,737 | $42,300 | $8,700 | $33,600 |
| 2016 | $11,738 | $42,300 | $8,700 | $33,600 |
| 2015 | $13,102 | $50,200 | $8,700 | $41,500 |
| 2014 | $12,709 | $50,200 | $8,700 | $41,500 |
Source: Public Records
Map
Nearby Homes
- 816-826 W Grand St Unit 2C
- 816 W Grand St Unit 3G
- 857 859pennington St
- 515 Pennington St
- 807 Canton St
- 455 W End Ave Unit 457
- 937 39pennington St
- 428 Jersey Unit 1
- 35 Bellewood Place Unit 37
- 827 Murray St Unit 829
- 349 W Grand St Unit 206
- 865 Westfield Ave
- 50 Palisade Rd Unit 52
- 13-15 Hillside Rd
- 322 Pennington St
- 713 E 3rd Ave
- 257 Lincoln Ave Unit 259
- 717 Galvin Ave
- 45 Summit Rd Unit 47
- 703 Elm St
- 189 Bellevue St
- 187 Bellevue St
- 191 Bellevue St
- 193 Bellevue St
- 757 Pennington St
- 759 Pennington St
- 753 Pennington St Unit 755
- 761 Pennington St Unit 763
- 751 Pennington St
- 747 Pennington St Unit 749
- 801 Pennington St Unit 3
- 752-754 W Grand St
- 752 W Grand St
- 752 W Grand St Unit 999
- 186 Bellevue St
- 188 Bellevue St
- 190 Bellevue St
- 743 Pennington St Unit 45
- 192 Bellevue St
- 741 Pennington St