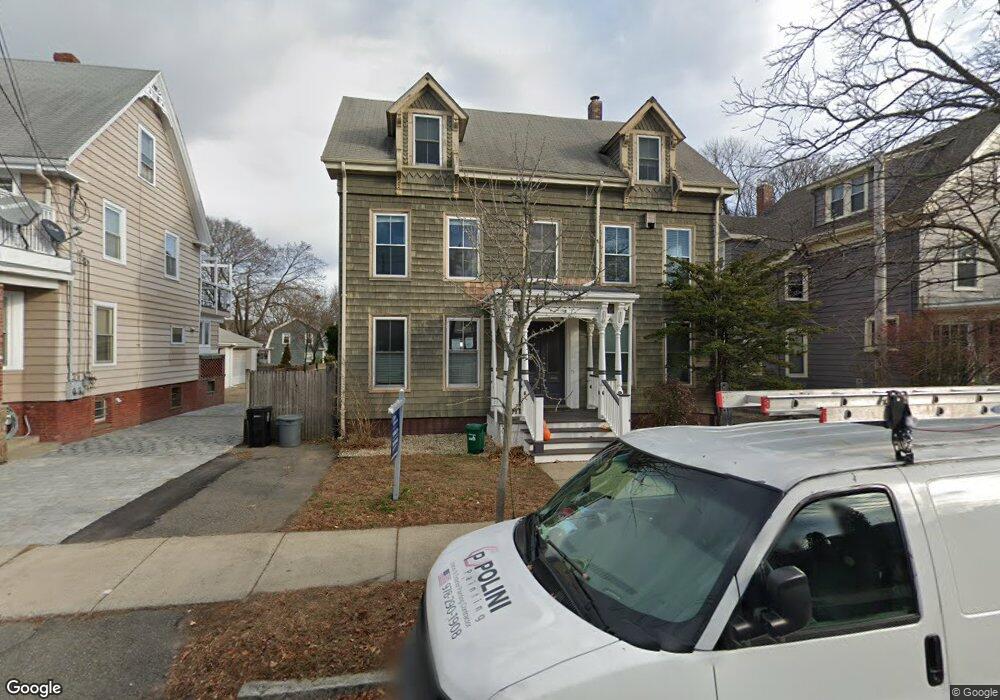
189 Burrill St Unit 1, 3 Swampscott, MA 01907
Estimated Value: $420,000 - $597,000
2
Beds
1
Bath
921
Sq Ft
$574/Sq Ft
Est. Value
About This Home
This home is located at 189 Burrill St Unit 1, 3, Swampscott, MA 01907 and is currently estimated at $528,721, approximately $574 per square foot. 189 Burrill St Unit 1, 3 is a home located in Essex County with nearby schools including Swampscott Middle School and Swampscott High School.
Ownership History
Date
Name
Owned For
Owner Type
Purchase Details
Closed on
Feb 11, 2021
Sold by
Sembhi Rupinder S and Sembhi Tript K
Bought by
Arsenault Samantha E and Barrett Robert D
Current Estimated Value
Home Financials for this Owner
Home Financials are based on the most recent Mortgage that was taken out on this home.
Original Mortgage
$356,000
Outstanding Balance
$318,127
Interest Rate
2.65%
Mortgage Type
Purchase Money Mortgage
Estimated Equity
$210,594
Purchase Details
Closed on
Apr 20, 2006
Sold by
Townsend Erland and Townsend Stephen
Bought by
Sembhi Rupinder Singh
Home Financials for this Owner
Home Financials are based on the most recent Mortgage that was taken out on this home.
Original Mortgage
$167,200
Interest Rate
6.37%
Mortgage Type
Purchase Money Mortgage
Purchase Details
Closed on
Oct 31, 1990
Sold by
Moineau James A
Bought by
Townsend Lois W
Create a Home Valuation Report for This Property
The Home Valuation Report is an in-depth analysis detailing your home's value as well as a comparison with similar homes in the area
Home Values in the Area
Average Home Value in this Area
Purchase History
| Date | Buyer | Sale Price | Title Company |
|---|---|---|---|
| Arsenault Samantha E | $445,000 | None Available | |
| Sembhi Rupinder Singh | $209,000 | -- | |
| Townsend Lois W | $116,000 | -- |
Source: Public Records
Mortgage History
| Date | Status | Borrower | Loan Amount |
|---|---|---|---|
| Open | Arsenault Samantha E | $356,000 | |
| Previous Owner | Townsend Lois W | $167,200 | |
| Previous Owner | Townsend Lois W | $41,800 | |
| Previous Owner | Townsend Lois W | $176,400 | |
| Previous Owner | Townsend Lois W | $140,000 |
Source: Public Records
Tax History Compared to Growth
Tax History
| Year | Tax Paid | Tax Assessment Tax Assessment Total Assessment is a certain percentage of the fair market value that is determined by local assessors to be the total taxable value of land and additions on the property. | Land | Improvement |
|---|---|---|---|---|
| 2025 | $6,343 | $553,000 | $0 | $553,000 |
| 2024 | $5,711 | $497,000 | $0 | $497,000 |
| 2023 | $5,262 | $448,200 | $0 | $448,200 |
| 2022 | $5,629 | $438,700 | $0 | $438,700 |
| 2021 | $4,136 | $299,700 | $0 | $299,700 |
| 2020 | $4,131 | $288,900 | $0 | $288,900 |
| 2019 | $3,952 | $260,000 | $0 | $260,000 |
| 2018 | $4,160 | $260,000 | $0 | $260,000 |
| 2017 | $4,368 | $250,300 | $0 | $250,300 |
| 2016 | $4,338 | $250,300 | $0 | $250,300 |
| 2015 | $4,053 | $236,300 | $0 | $236,300 |
| 2014 | $3,009 | $160,900 | $0 | $160,900 |
Source: Public Records
Map
Nearby Homes
- 189 Burrill St Unit 2
- 80 Norfolk Ave Unit 1
- 30 Paradise Rd
- 29-31 Essex Ave Unit 2
- 106 Norfolk Ave
- 98 Paradise Rd
- 108-110 Burrill St Unit 1
- 133 Eastern Ave Unit 8
- 35 Columbia Ave
- 7-9 Rock Ave
- 28 Claremont Terrace Unit 4
- 28 Claremont Terrace Unit 6
- 44 Cherry St Unit 2
- 76 Stetson Ave
- 140 Elmwood Rd
- 59 Essex St Unit 59B
- 100 Burpee Rd
- 46 Wardwell Ave
- 26 Groveland St
- 51 Barnstable St
- 189 Burrill St Unit 3
- 189 Burrill St Unit 1
- 187 Burrill St Unit 2
- 187 Burrill St Unit 1
- 1 Higgins Terrace
- 195 Burrill St
- 2 Higgins Terrace
- 199 Burrill St
- 199 Burrill St Unit 2
- 199 Burrill St Unit 1
- 23 Railroad Ave Unit 4
- 21 Railroad Ave Unit 1
- 23 Railroad Ave Unit 8
- 23 Railroad Ave Unit 7
- 23 Railroad Ave Unit 5
- 23 Railroad Ave
- 21 Railroad Ave
- 23 Railroad Ave Unit 1
- 185 Burrill St
- 190 Burrill St