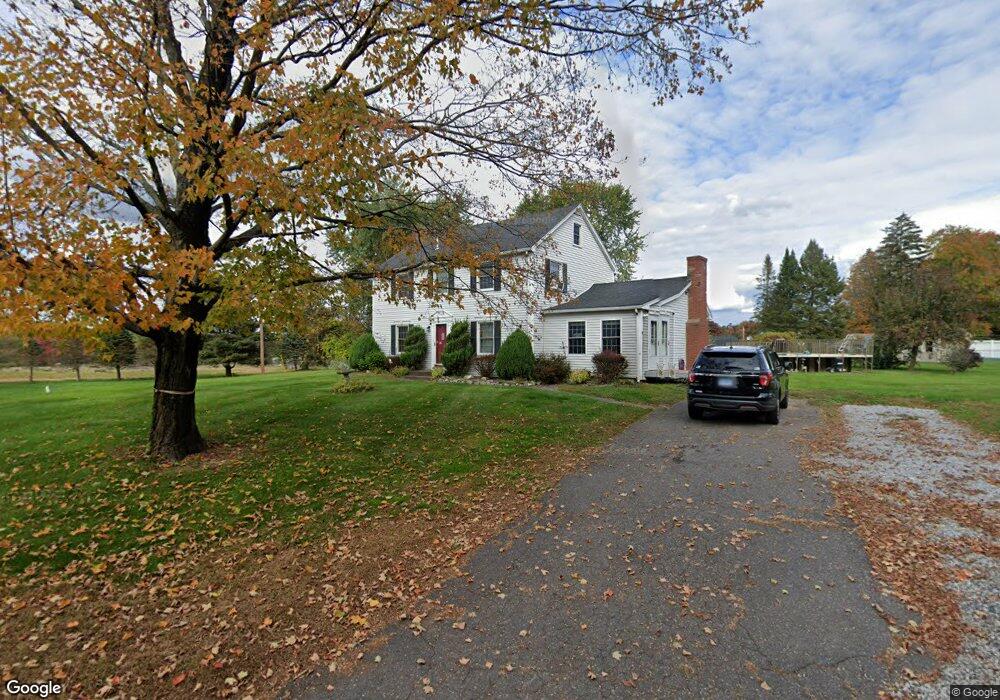
189 Chamberlain Rd Broad Brook, CT 06016
Estimated Value: $389,000 - $595,000
4
Beds
3
Baths
1,842
Sq Ft
$250/Sq Ft
Est. Value
About This Home
This home is located at 189 Chamberlain Rd, Broad Brook, CT 06016 and is currently estimated at $460,269, approximately $249 per square foot. 189 Chamberlain Rd is a home located in Hartford County with nearby schools including Broad Brook Elementary School, East Windsor Middle School, and East Windsor High School.
Ownership History
Date
Name
Owned For
Owner Type
Purchase Details
Closed on
Jul 19, 1999
Sold by
Vesce Richard
Bought by
Maloney Michael and Slesinski Nicole
Current Estimated Value
Home Financials for this Owner
Home Financials are based on the most recent Mortgage that was taken out on this home.
Original Mortgage
$127,812
Outstanding Balance
$35,321
Interest Rate
7.39%
Estimated Equity
$424,948
Create a Home Valuation Report for This Property
The Home Valuation Report is an in-depth analysis detailing your home's value as well as a comparison with similar homes in the area
Home Values in the Area
Average Home Value in this Area
Purchase History
| Date | Buyer | Sale Price | Title Company |
|---|---|---|---|
| Maloney Michael | $135,000 | -- |
Source: Public Records
Mortgage History
| Date | Status | Borrower | Loan Amount |
|---|---|---|---|
| Open | Maloney Michael | $12,116 | |
| Open | Maloney Michael | $127,812 | |
| Previous Owner | Maloney Michael | $100,000 |
Source: Public Records
Tax History
| Year | Tax Paid | Tax Assessment Tax Assessment Total Assessment is a certain percentage of the fair market value that is determined by local assessors to be the total taxable value of land and additions on the property. | Land | Improvement |
|---|---|---|---|---|
| 2025 | $6,238 | $235,480 | $62,240 | $173,240 |
| 2024 | $5,783 | $235,480 | $62,240 | $173,240 |
| 2023 | $4,334 | $126,430 | $49,020 | $77,410 |
| 2022 | $4,689 | $126,430 | $49,020 | $77,410 |
| 2021 | $4,362 | $126,430 | $49,020 | $77,410 |
| 2020 | $4,390 | $126,430 | $49,020 | $77,410 |
| 2019 | $4,330 | $126,430 | $49,020 | $77,410 |
| 2018 | $4,286 | $126,430 | $49,020 | $77,410 |
| 2017 | $4,410 | $134,580 | $57,320 | $77,260 |
| 2016 | $4,163 | $134,580 | $57,320 | $77,260 |
| 2015 | $3,968 | $130,930 | $57,320 | $73,610 |
| 2014 | $3,899 | $130,930 | $57,320 | $73,610 |
Source: Public Records
Map
Nearby Homes
- 183 Chamberlain Rd
- 77 Thrall Rd
- 160 East Rd
- 164 East Rd
- 4 Jessie Ln
- 0 Thrall Rd Unit 24150600
- 56 Highland Ave
- 13 Reservoir Ave
- 111 Old Ellington Rd
- 72 Rockville Rd
- 4 Rye St
- 20 Apothecaries Hall Rd
- 0 Chamberlain Rd Unit 24154561
- 3 Meagan Cir
- 26 Julia Ct Unit 26
- 11 Settlers Way
- 10 Thistle Way Unit D
- 96 Muddy Brook Rd
- 27 Folkstone Rd Unit C
- 3 Brookmeadow Ln
Your Personal Tour Guide
Ask me questions while you tour the home.