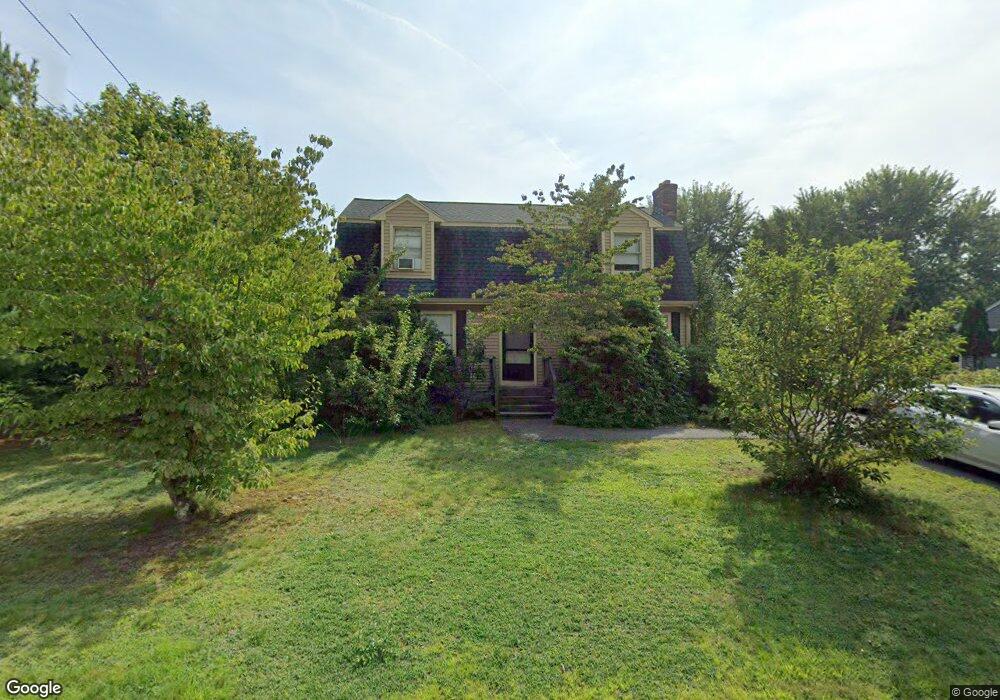
189 Dexter St Attleboro, MA 02703
Estimated Value: $505,000 - $628,000
3
Beds
2
Baths
1,746
Sq Ft
$329/Sq Ft
Est. Value
About This Home
This home is located at 189 Dexter St, Attleboro, MA 02703 and is currently estimated at $573,694, approximately $328 per square foot. 189 Dexter St is a home located in Bristol County with nearby schools including Peter Thacher Elementary School, Wamsutta Middle School, and Attleboro High School.
Ownership History
Date
Name
Owned For
Owner Type
Purchase Details
Closed on
Mar 3, 2021
Sold by
Fye Kenneth P
Bought by
Kenneth P Fye Ret
Current Estimated Value
Purchase Details
Closed on
Aug 3, 1994
Sold by
Segal Bernard O and Segal Lucy R
Bought by
Fye Kenneth P
Home Financials for this Owner
Home Financials are based on the most recent Mortgage that was taken out on this home.
Original Mortgage
$40,000
Interest Rate
8.4%
Mortgage Type
Purchase Money Mortgage
Purchase Details
Closed on
Apr 30, 1987
Sold by
Par Bldrs Inc
Bought by
Segal Bernard O
Home Financials for this Owner
Home Financials are based on the most recent Mortgage that was taken out on this home.
Original Mortgage
$120,000
Interest Rate
8.99%
Mortgage Type
Purchase Money Mortgage
Create a Home Valuation Report for This Property
The Home Valuation Report is an in-depth analysis detailing your home's value as well as a comparison with similar homes in the area
Home Values in the Area
Average Home Value in this Area
Purchase History
| Date | Buyer | Sale Price | Title Company |
|---|---|---|---|
| Kenneth P Fye Ret | -- | None Available | |
| Fye Kenneth P | $140,000 | -- | |
| Segal Bernard O | $154,900 | -- |
Source: Public Records
Mortgage History
| Date | Status | Borrower | Loan Amount |
|---|---|---|---|
| Previous Owner | Segal Bernard O | $40,000 | |
| Previous Owner | Segal Bernard O | $120,000 |
Source: Public Records
Tax History Compared to Growth
Tax History
| Year | Tax Paid | Tax Assessment Tax Assessment Total Assessment is a certain percentage of the fair market value that is determined by local assessors to be the total taxable value of land and additions on the property. | Land | Improvement |
|---|---|---|---|---|
| 2025 | $5,973 | $475,900 | $173,300 | $302,600 |
| 2024 | $5,675 | $445,800 | $155,900 | $289,900 |
| 2023 | $5,197 | $379,600 | $157,500 | $222,100 |
| 2022 | $5,107 | $353,400 | $150,100 | $203,300 |
| 2021 | $4,834 | $326,600 | $144,200 | $182,400 |
| 2020 | $4,697 | $322,600 | $137,800 | $184,800 |
| 2019 | $4,332 | $305,900 | $135,300 | $170,600 |
| 2018 | $4,482 | $302,400 | $131,200 | $171,200 |
| 2017 | $3,962 | $272,300 | $127,900 | $144,400 |
| 2016 | $3,835 | $258,800 | $119,500 | $139,300 |
| 2015 | $3,833 | $260,600 | $119,500 | $141,100 |
| 2014 | $3,666 | $246,900 | $114,200 | $132,700 |
Source: Public Records
Map
Nearby Homes