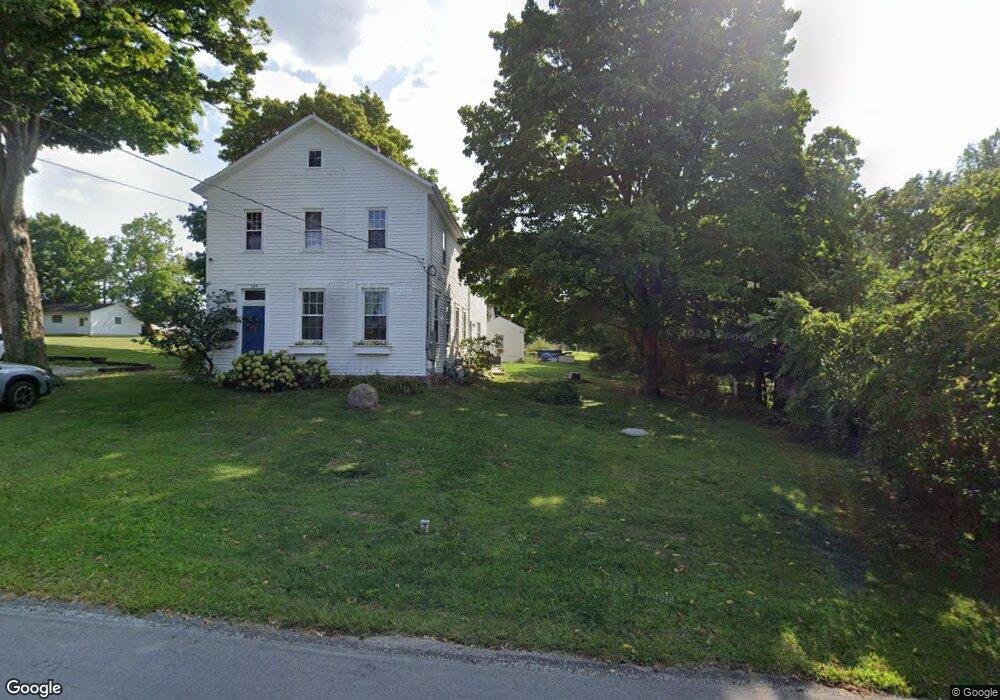
189 E South St Lithopolis, OH 43136
Bloom NeighborhoodEstimated Value: $306,000 - $418,000
4
Beds
3
Baths
2,576
Sq Ft
$136/Sq Ft
Est. Value
About This Home
This home is located at 189 E South St, Lithopolis, OH 43136 and is currently estimated at $349,472, approximately $135 per square foot. 189 E South St is a home with nearby schools including Bloom Carroll Primary School, Bloom Carroll Intermediate School, and Bloom-Carroll Middle School.
Ownership History
Date
Name
Owned For
Owner Type
Purchase Details
Closed on
Aug 4, 2022
Sold by
Sandine Eric P
Bought by
Sandine Eric P and Kochenderfer Kelly A
Current Estimated Value
Home Financials for this Owner
Home Financials are based on the most recent Mortgage that was taken out on this home.
Original Mortgage
$250,000
Outstanding Balance
$236,382
Interest Rate
4.75%
Mortgage Type
Construction
Estimated Equity
$113,090
Purchase Details
Closed on
Feb 19, 1999
Sold by
Adams John M
Bought by
Sandine Eric P
Home Financials for this Owner
Home Financials are based on the most recent Mortgage that was taken out on this home.
Original Mortgage
$114,240
Interest Rate
6.88%
Mortgage Type
VA
Create a Home Valuation Report for This Property
The Home Valuation Report is an in-depth analysis detailing your home's value as well as a comparison with similar homes in the area
Home Values in the Area
Average Home Value in this Area
Purchase History
| Date | Buyer | Sale Price | Title Company |
|---|---|---|---|
| Sandine Eric P | -- | None Listed On Document | |
| Sandine Eric P | $114,240 | -- |
Source: Public Records
Mortgage History
| Date | Status | Borrower | Loan Amount |
|---|---|---|---|
| Open | Sandine Eric P | $250,000 | |
| Previous Owner | Sandine Eric P | $114,240 |
Source: Public Records
Tax History
| Year | Tax Paid | Tax Assessment Tax Assessment Total Assessment is a certain percentage of the fair market value that is determined by local assessors to be the total taxable value of land and additions on the property. | Land | Improvement |
|---|---|---|---|---|
| 2025 | $5,985 | $105,140 | $31,200 | $73,940 |
| 2024 | $5,985 | $75,380 | $19,650 | $55,730 |
| 2023 | $2,608 | $63,600 | $19,650 | $43,950 |
| 2022 | $1,995 | $47,180 | $19,650 | $27,530 |
| 2021 | $1,848 | $39,730 | $19,650 | $20,080 |
| 2020 | $1,869 | $39,730 | $19,650 | $20,080 |
| 2019 | $1,875 | $39,730 | $19,650 | $20,080 |
| 2018 | $1,666 | $32,140 | $16,740 | $15,400 |
| 2017 | $1,568 | $35,940 | $16,740 | $19,200 |
| 2016 | $1,544 | $35,940 | $16,740 | $19,200 |
| 2015 | $1,548 | $35,070 | $16,740 | $18,330 |
| 2014 | $1,496 | $35,070 | $16,740 | $18,330 |
| 2013 | $1,496 | $35,070 | $16,740 | $18,330 |
Source: Public Records
Map
Nearby Homes
- 19 W Columbus St
- 0 Sycamore Bluff Way
- 517 Market St Unit 517
- 539 S Market St
- 0 Columbus St Unit 225023784
- 777 Faulkner Dr
- 678 Green Forest Place
- 89 Wheatley St
- 680 Crestview Dr
- 5225 Lithopolis Winchester Nw Rd
- 557 Eastman Ave
- 1375 Hansberry Dr
- 631 Rolling Acre Dr
- 607 Eastman Ave
- 146 Poe Ave
- 94 Sandburg Dr
- 248 Faulkner Dr
- 290 Jonathan Trail
- 197 Faulkner Dr
- 5795 Lithopolis Winchester Rd NW
- 165 E South St
- 178 E South St
- 189 E South St
- 207 E South St
- 188 E South St
- 153 E South St
- 90 Brown St
- 90 S Brown St
- 235 E South St
- 222 E South St
- 178 E South St
- 143 E South St
- 143 E B E South St
- 77 Cemetery Rd
- 144 E South St
- 67 Cemetery Rd
- 133 E South St
- 150 S Walnut St
- 205 E Columbus St
- 191 E Columbus St
Your Personal Tour Guide
Ask me questions while you tour the home.