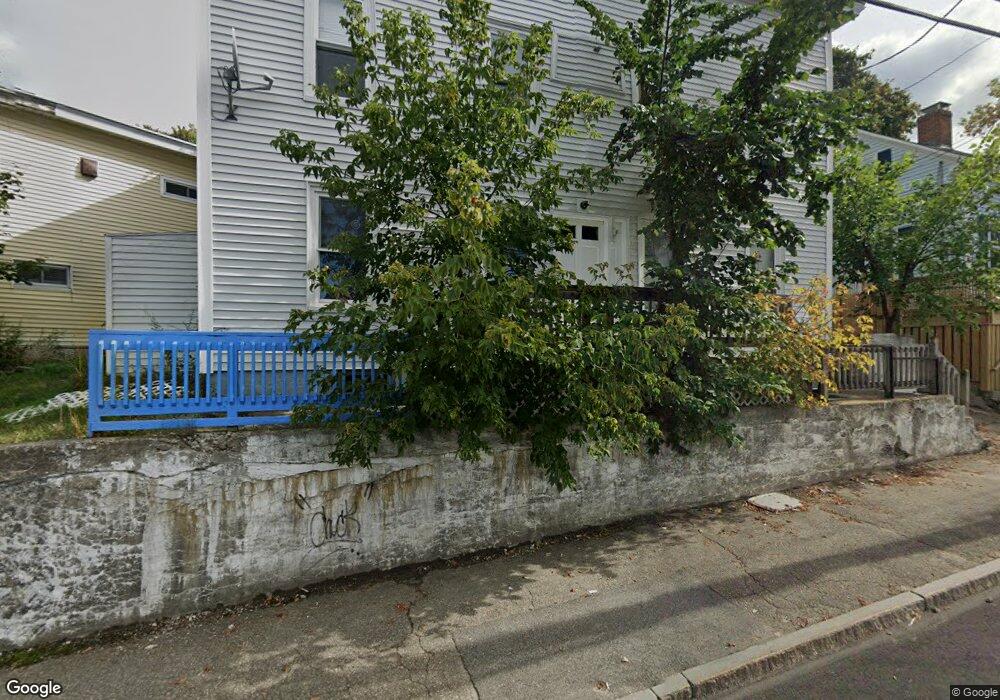
189 Elm St Unit B Biddeford, ME 04005
Downtown Biddeford NeighborhoodEstimated Value: $329,000 - $346,575
3
Beds
2
Baths
1,063
Sq Ft
$318/Sq Ft
Est. Value
About This Home
This home is located at 189 Elm St Unit B, Biddeford, ME 04005 and is currently estimated at $338,394, approximately $318 per square foot. 189 Elm St Unit B is a home located in York County with nearby schools including John F Kennedy Memorial School, Biddeford Primary School, and Biddeford Intermediate School.
Ownership History
Date
Name
Owned For
Owner Type
Purchase Details
Closed on
Sep 19, 2025
Sold by
28 Copeland Llc
Bought by
Mcphall Samantha and Ito Nicholas
Current Estimated Value
Home Financials for this Owner
Home Financials are based on the most recent Mortgage that was taken out on this home.
Original Mortgage
$268,000
Outstanding Balance
$268,000
Interest Rate
6.63%
Mortgage Type
New Conventional
Estimated Equity
$70,394
Purchase Details
Closed on
Apr 29, 2024
Sold by
Newrez Llc
Bought by
28 Copeland Llc
Purchase Details
Closed on
Mar 27, 2017
Sold by
Cote Kathleen B
Bought by
Koster Benjamin I
Home Financials for this Owner
Home Financials are based on the most recent Mortgage that was taken out on this home.
Original Mortgage
$124,242
Interest Rate
4.17%
Mortgage Type
New Conventional
Purchase Details
Closed on
Sep 25, 2012
Sold by
Gurry Cynthia L and Gurry Robert E
Bought by
Cote Kathleen B
Home Financials for this Owner
Home Financials are based on the most recent Mortgage that was taken out on this home.
Original Mortgage
$98,188
Interest Rate
3.59%
Mortgage Type
FHA
Purchase Details
Closed on
Jul 7, 2008
Sold by
Biddeford City Of
Bought by
Beaupre John and Beaupre Jenny
Purchase Details
Closed on
Apr 7, 2008
Sold by
Deutsche Bk Natl T Co Tr
Bought by
Gurry Robert E and Gurry Cynthia L
Create a Home Valuation Report for This Property
The Home Valuation Report is an in-depth analysis detailing your home's value as well as a comparison with similar homes in the area
Home Values in the Area
Average Home Value in this Area
Purchase History
| Date | Buyer | Sale Price | Title Company |
|---|---|---|---|
| Mcphall Samantha | $335,000 | -- | |
| 28 Copeland Llc | $200,000 | None Available | |
| Koster Benjamin I | -- | -- | |
| Cote Kathleen B | -- | -- | |
| Cote Kathleen B | -- | -- | |
| Beaupre John | -- | -- | |
| Gurry Robert E | -- | -- | |
| Koster Benjamin I | -- | -- | |
| Cote Kathleen B | -- | -- |
Source: Public Records
Mortgage History
| Date | Status | Borrower | Loan Amount |
|---|---|---|---|
| Open | Mcphall Samantha | $268,000 | |
| Previous Owner | Koster Benjamin I | $124,242 | |
| Previous Owner | Cote Kathleen B | $98,188 |
Source: Public Records
Tax History Compared to Growth
Tax History
| Year | Tax Paid | Tax Assessment Tax Assessment Total Assessment is a certain percentage of the fair market value that is determined by local assessors to be the total taxable value of land and additions on the property. | Land | Improvement |
|---|---|---|---|---|
| 2024 | $2,902 | $204,100 | $110,000 | $94,100 |
| 2023 | $2,678 | $204,100 | $110,000 | $94,100 |
| 2022 | $2,631 | $160,300 | $55,000 | $105,300 |
| 2021 | $2,487 | $136,400 | $45,000 | $91,400 |
| 2020 | $2,484 | $123,900 | $35,000 | $88,900 |
| 2019 | $2,476 | $123,900 | $35,000 | $88,900 |
| 2018 | $2,441 | $123,900 | $35,000 | $88,900 |
| 2017 | $2,487 | $123,900 | $35,000 | $88,900 |
| 2016 | $2,782 | $140,100 | $35,000 | $105,100 |
| 2015 | $2,728 | $140,100 | $35,000 | $105,100 |
| 2014 | $2,661 | $140,100 | $35,000 | $105,100 |
| 2013 | -- | $150,300 | $51,200 | $99,100 |
Source: Public Records
Map
Nearby Homes
- 227 Elm St
- 21 Wentworth St
- 4 Kossuth St
- 39 Green St
- 28 Cutts St
- 11 Chadwick Place
- 38 South St
- 38 Jefferson St
- 128 Alfred St
- 109 Alfred Rd
- 63 Western Ave
- 20 Hooper St
- 11 King St
- 2 Main St Unit 17-506
- 2 Main St Unit 15-310
- 2 Main St Unit 18-420
- 2 Main St Unit 15-314
- 2 Main St Unit 17-410
- 2 Main St Unit 17-508
- 2 Main St Unit 15-403
- 189 Elm St Unit A
- 189 Elm St Unit 1
- 59 Center St Unit 201
- 59 Center St Unit 102
- 59 Center St Unit 101
- 59 Center St
- 59 Center St Unit 301
- 59 Center St
- 197 Elm St
- 7 Williams Ct
- 7 William's
- 10 Williams Ct
- 190 Elm St
- 201 Elm St
- 5 Williams Ct
- 8@15 Williams
- 43 Center St
- 0 Williams Rd
- 21 Saint Joseph St
- 70 South St