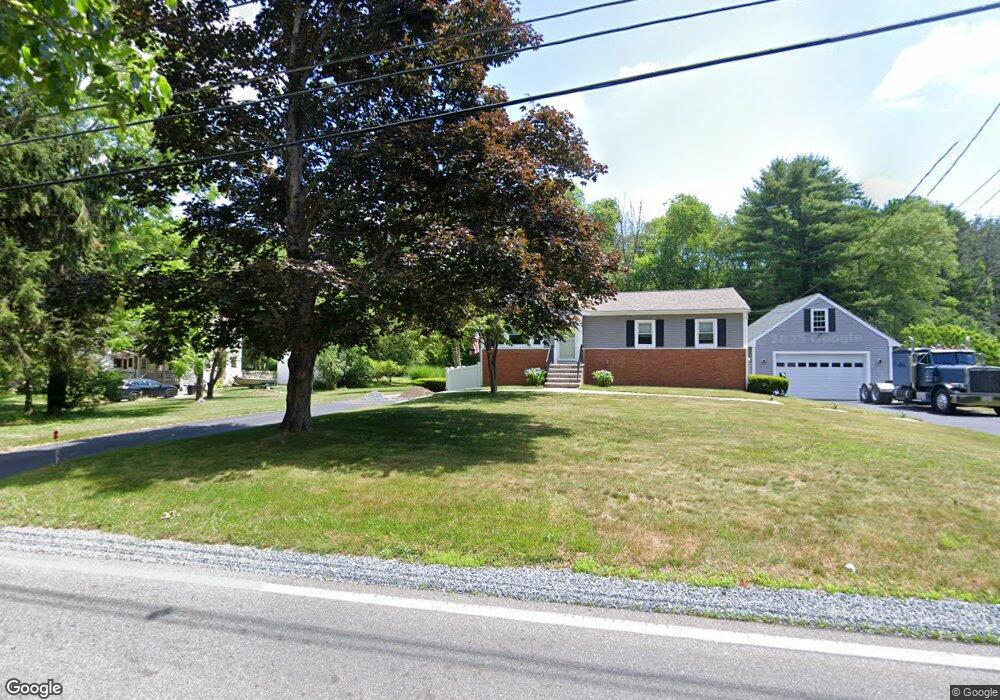
189 Elm St Hanson, MA 02341
Estimated Value: $493,000 - $572,000
3
Beds
2
Baths
994
Sq Ft
$525/Sq Ft
Est. Value
About This Home
This home is located at 189 Elm St, Hanson, MA 02341 and is currently estimated at $521,400, approximately $524 per square foot. 189 Elm St is a home located in Plymouth County.
Ownership History
Date
Name
Owned For
Owner Type
Purchase Details
Closed on
Jul 12, 2024
Sold by
Ibbitson George D and Ibbitson Rachelle A
Bought by
Ibbitson
Current Estimated Value
Purchase Details
Closed on
Aug 24, 2007
Sold by
Ibbitson Elaine M and Ibbitson George D
Bought by
Ibbitson George D and Ibbitson Rachelle A
Home Financials for this Owner
Home Financials are based on the most recent Mortgage that was taken out on this home.
Original Mortgage
$112,000
Interest Rate
6.78%
Mortgage Type
Purchase Money Mortgage
Create a Home Valuation Report for This Property
The Home Valuation Report is an in-depth analysis detailing your home's value as well as a comparison with similar homes in the area
Home Values in the Area
Average Home Value in this Area
Purchase History
| Date | Buyer | Sale Price | Title Company |
|---|---|---|---|
| Ibbitson | -- | None Available | |
| Ibbitson | -- | None Available | |
| Ibbitson George D | -- | -- | |
| Ibbitson George D | -- | -- |
Source: Public Records
Mortgage History
| Date | Status | Borrower | Loan Amount |
|---|---|---|---|
| Previous Owner | Ibbitson George D | $112,000 | |
| Previous Owner | Ibbitson George D | $85,000 |
Source: Public Records
Tax History Compared to Growth
Tax History
| Year | Tax Paid | Tax Assessment Tax Assessment Total Assessment is a certain percentage of the fair market value that is determined by local assessors to be the total taxable value of land and additions on the property. | Land | Improvement |
|---|---|---|---|---|
| 2025 | $5,981 | $447,000 | $175,000 | $272,000 |
| 2024 | $5,810 | $434,200 | $170,000 | $264,200 |
| 2023 | $5,756 | $405,900 | $170,000 | $235,900 |
| 2022 | $5,570 | $369,100 | $154,500 | $214,600 |
| 2021 | $4,935 | $326,800 | $148,600 | $178,200 |
| 2020 | $4,448 | $291,300 | $143,500 | $147,800 |
| 2019 | $3,836 | $247,000 | $140,800 | $106,200 |
| 2018 | $3,788 | $239,300 | $135,400 | $103,900 |
| 2017 | $3,671 | $229,700 | $128,900 | $100,800 |
| 2016 | $3,730 | $225,400 | $128,900 | $96,500 |
| 2015 | $3,555 | $223,300 | $128,900 | $94,400 |
Source: Public Records
Map
Nearby Homes