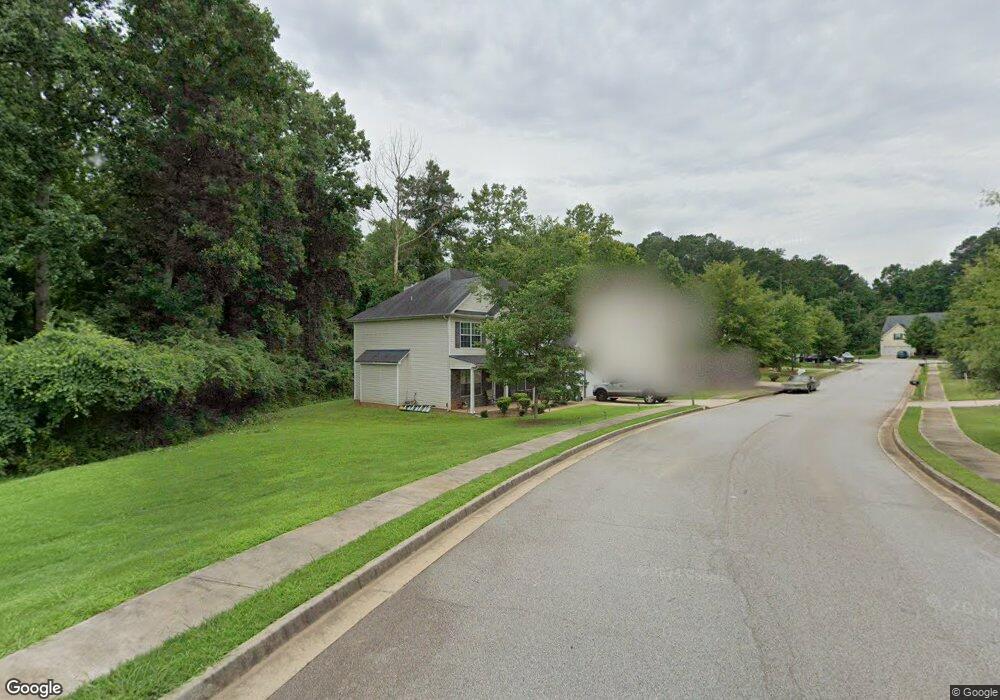
189 Hightower Trail Riverdale, GA 30274
Estimated Value: $267,136 - $377,000
4
Beds
3
Baths
2,708
Sq Ft
$122/Sq Ft
Est. Value
About This Home
This home is located at 189 Hightower Trail, Riverdale, GA 30274 and is currently estimated at $331,534, approximately $122 per square foot. 189 Hightower Trail is a home located in Clayton County with nearby schools including Callaway Elementary School, Kendrick Middle School, and Riverdale High School.
Ownership History
Date
Name
Owned For
Owner Type
Purchase Details
Closed on
Dec 13, 2019
Sold by
Oney Henry L
Bought by
Oney Henry L and Oney O
Current Estimated Value
Home Financials for this Owner
Home Financials are based on the most recent Mortgage that was taken out on this home.
Original Mortgage
$153,082
Outstanding Balance
$136,630
Interest Rate
4.25%
Mortgage Type
FHA
Estimated Equity
$194,904
Purchase Details
Closed on
Feb 27, 2012
Sold by
Oney Henry L
Bought by
Oney Henry L and Oney Tanzia Dixon
Purchase Details
Closed on
Sep 24, 2007
Sold by
Oney Henry L
Bought by
Oney Henry L and Foster-Oney Glenda
Purchase Details
Closed on
Mar 16, 2007
Sold by
Scenic Homes
Bought by
Onley Henry L
Home Financials for this Owner
Home Financials are based on the most recent Mortgage that was taken out on this home.
Original Mortgage
$188,871
Interest Rate
6.27%
Mortgage Type
FHA
Create a Home Valuation Report for This Property
The Home Valuation Report is an in-depth analysis detailing your home's value as well as a comparison with similar homes in the area
Home Values in the Area
Average Home Value in this Area
Purchase History
| Date | Buyer | Sale Price | Title Company |
|---|---|---|---|
| Oney Henry L | -- | -- | |
| Oney Henry L | -- | -- | |
| Oney Henry L | -- | -- | |
| Oney Henry L | -- | -- | |
| Onley Henry L | $190,400 | -- |
Source: Public Records
Mortgage History
| Date | Status | Borrower | Loan Amount |
|---|---|---|---|
| Open | Oney Henry L | $153,082 | |
| Previous Owner | Onley Henry L | $188,871 |
Source: Public Records
Tax History Compared to Growth
Tax History
| Year | Tax Paid | Tax Assessment Tax Assessment Total Assessment is a certain percentage of the fair market value that is determined by local assessors to be the total taxable value of land and additions on the property. | Land | Improvement |
|---|---|---|---|---|
| 2024 | $1,246 | $71,600 | $9,600 | $62,000 |
| 2023 | $2,610 | $72,280 | $9,600 | $62,680 |
| 2022 | $919 | $55,160 | $9,600 | $45,560 |
| 2021 | $918 | $54,520 | $9,600 | $44,920 |
| 2020 | $945 | $54,740 | $9,600 | $45,140 |
| 2019 | $1,118 | $61,837 | $9,600 | $52,237 |
| 2018 | $1,103 | $61,147 | $9,600 | $51,547 |
| 2017 | $1,092 | $58,260 | $9,600 | $48,660 |
| 2016 | $1,092 | $58,260 | $9,600 | $48,660 |
| 2015 | $1,067 | $0 | $0 | $0 |
| 2014 | $949 | $55,239 | $9,600 | $45,639 |
Source: Public Records
Map
Nearby Homes
- 7461 Cardinal Way
- 8630 WEBB Rd
- 113 Hager Dr
- 45 Heron Dr
- 80 Rountree Rd
- 82 Heron Dr
- 245 Antebellum Cir
- 51 Rountree Rd
- 7673 Cloverdale Ln
- 96 Sedgefield Dr
- 194 Lexington Ct
- 198 Lexington Ct Unit 3
- 7560 Taylor Rd Unit 5
- 182 Iris Ct
- 7584 Ann St
- 213 Whipporwill Way
- 7582 Smith Ct
- 7103 Apache Ln
- 7371 Ovis Ct
- 36 Highway 138 SW
- 0 Hightower Trail Unit 3212038
- 0 Hightower Trail Unit 3212082
- 197 Hightower Trail
- 196 Hightower Trail
- 188 Hightower Trail
- 205 Hightower Trail
- 204 Hightower Trail
- 204 Hightower Trail Unit 3
- 157 Rountree Rd
- 7440 Ledgestone Ln
- 213 Hightower Trail
- 7446 Ledgestone Ln
- 178 Rountree Rd
- 7434 Ledgestone Ln
- 7452 Ledgestone Ln
- 10 Windgate Dr
- 7458 Ledgestone Ln
- 220 Hightower Trail
- 221 Hightower Trail
- 7464 Ledgestone Ln