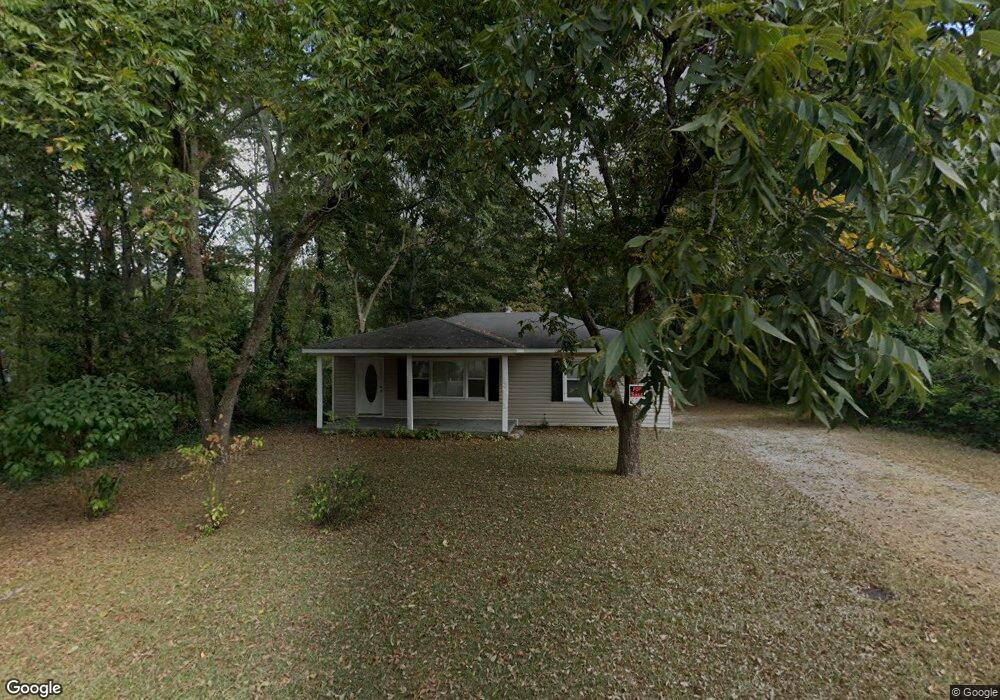
189 Johnson St Barnesville, GA 30204
Estimated Value: $115,000 - $150,000
3
Beds
1
Bath
1,144
Sq Ft
$114/Sq Ft
Est. Value
About This Home
This home is located at 189 Johnson St, Barnesville, GA 30204 and is currently estimated at $130,983, approximately $114 per square foot. 189 Johnson St is a home with nearby schools including Lamar County Primary School, Lamar County Elementary School, and Lamar County Middle School.
Ownership History
Date
Name
Owned For
Owner Type
Purchase Details
Closed on
Dec 15, 2007
Sold by
Not Provided
Bought by
Hinds Errol G
Current Estimated Value
Purchase Details
Closed on
Jul 6, 2007
Sold by
Not Provided
Bought by
Hinds Errol G
Home Financials for this Owner
Home Financials are based on the most recent Mortgage that was taken out on this home.
Original Mortgage
$100,000,000
Interest Rate
6.52%
Mortgage Type
New Conventional
Purchase Details
Closed on
Dec 6, 2005
Sold by
Wells Fargo Bank
Bought by
Secretary Of Housing % Development
Purchase Details
Closed on
Apr 4, 2002
Sold by
Stinson Marvin
Bought by
Leggett Grace and Leggett Thomas
Purchase Details
Closed on
Apr 7, 1998
Sold by
United Bk (Long)
Bought by
Stinson Marvin
Create a Home Valuation Report for This Property
The Home Valuation Report is an in-depth analysis detailing your home's value as well as a comparison with similar homes in the area
Purchase History
| Date | Buyer | Sale Price | Title Company |
|---|---|---|---|
| Hinds Errol G | $30,000 | -- | |
| Hinds Errol G | -- | -- | |
| Bermudez Geminess | $25,000 | -- | |
| Secretary Of Housing % Development | -- | -- | |
| Leggett Grace | $57,300 | -- | |
| Stinson Marvin | $35,300 | -- |
Source: Public Records
Mortgage History
| Date | Status | Borrower | Loan Amount |
|---|---|---|---|
| Previous Owner | Bermudez Geminess | $100,000,000 |
Source: Public Records
Tax History
| Year | Tax Paid | Tax Assessment Tax Assessment Total Assessment is a certain percentage of the fair market value that is determined by local assessors to be the total taxable value of land and additions on the property. | Land | Improvement |
|---|---|---|---|---|
| 2025 | $1,068 | $44,056 | $3,800 | $40,256 |
| 2024 | $907 | $35,422 | $3,000 | $32,422 |
| 2023 | $923 | $33,432 | $3,000 | $30,432 |
| 2022 | $851 | $30,840 | $2,400 | $28,440 |
| 2021 | $543 | $18,052 | $2,400 | $15,652 |
| 2020 | $571 | $18,052 | $2,400 | $15,652 |
| 2019 | $573 | $18,052 | $2,400 | $15,652 |
| 2018 | $550 | $18,052 | $2,400 | $15,652 |
| 2017 | $547 | $18,052 | $2,400 | $15,652 |
| 2016 | $547 | $18,052 | $2,400 | $15,652 |
| 2015 | $547 | $18,052 | $2,400 | $15,652 |
| 2014 | $571 | $19,472 | $3,381 | $16,091 |
| 2013 | -- | $19,472 | $3,381 | $16,091 |
Source: Public Records
Map
Nearby Homes
- 121 Westchester Dr
- 178 Barnesville Ave
- 13 Brown St
- 407 Westchester Dr
- 109 Barnesville Ave
- 163 Grove St
- 149 Akins St
- 339 Atlanta St
- 250 Mill St
- 275 Rose Ave
- 642 Greenwood St
- 531 Thomaston St
- 7 Jackson St
- 696 Georgia 18
- 696 Highway 18 W
- 107 1st St
- 114 Stafford Ave
- 0 Washington St Unit 10710879
- 149 Holmes St
- 147 Stafford Ave
- 192 Johnson St
- 182 Johnson St
- 185 Church St
- 124 Westchester Dr
- 183 Church St
- 173 Johnson St
- 189 Church St
- 107 Ashley Ct
- 179 Church St
- 122 Westchester Dr
- 96 Ashley Ct
- 167 Johnson St
- 120 Westchester Dr
- 173 Church St
- 166 Johnson St Unit 1
- 166 Johnson St
- 195 Church St
- 186 Church St
- 182 Church St
- 182 Church St
Your Personal Tour Guide
Ask me questions while you tour the home.