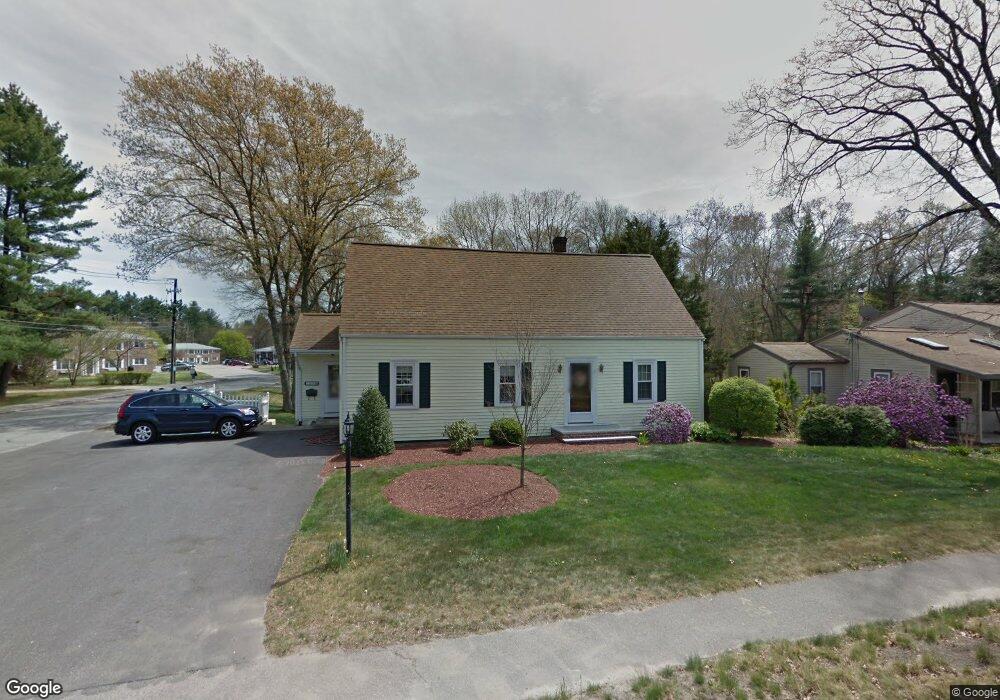
189 Matfield St West Bridgewater, MA 02379
Estimated Value: $550,000 - $649,043
3
Beds
3
Baths
2,218
Sq Ft
$277/Sq Ft
Est. Value
About This Home
This home is located at 189 Matfield St, West Bridgewater, MA 02379 and is currently estimated at $614,261, approximately $276 per square foot. 189 Matfield St is a home located in Plymouth County with nearby schools including Spring Street Elementary School, Howard Elementary School, and Rose L. MacDonald Elementary School.
Ownership History
Date
Name
Owned For
Owner Type
Purchase Details
Closed on
Jul 6, 2020
Sold by
Brearley Edward L and Brearley Nancy M
Bought by
Brearley Irt
Current Estimated Value
Purchase Details
Closed on
Aug 14, 1985
Bought by
Brearley Edward L and Brearley Nancy M
Create a Home Valuation Report for This Property
The Home Valuation Report is an in-depth analysis detailing your home's value as well as a comparison with similar homes in the area
Home Values in the Area
Average Home Value in this Area
Purchase History
| Date | Buyer | Sale Price | Title Company |
|---|---|---|---|
| Brearley Irt | -- | None Available | |
| Brearley Edward L | -- | -- |
Source: Public Records
Mortgage History
| Date | Status | Borrower | Loan Amount |
|---|---|---|---|
| Previous Owner | Brearley Edward L | $110,000 | |
| Previous Owner | Brearley Edward L | $100,000 | |
| Previous Owner | Brearley Edward L | $147,000 |
Source: Public Records
Tax History Compared to Growth
Tax History
| Year | Tax Paid | Tax Assessment Tax Assessment Total Assessment is a certain percentage of the fair market value that is determined by local assessors to be the total taxable value of land and additions on the property. | Land | Improvement |
|---|---|---|---|---|
| 2025 | $7,137 | $522,100 | $227,900 | $294,200 |
| 2024 | $6,600 | $465,800 | $206,600 | $259,200 |
| 2023 | $6,025 | $392,000 | $178,900 | $213,100 |
| 2022 | $5,675 | $349,900 | $168,300 | $181,600 |
| 2021 | $5,623 | $336,500 | $168,300 | $168,200 |
| 2020 | $5,509 | $336,500 | $168,300 | $168,200 |
| 2019 | $5,508 | $333,200 | $168,300 | $164,900 |
| 2018 | $5,412 | $316,500 | $159,800 | $156,700 |
| 2017 | $5,255 | $296,400 | $144,800 | $151,600 |
| 2016 | $5,152 | $286,200 | $134,600 | $151,600 |
| 2015 | $4,800 | $269,500 | $134,600 | $134,900 |
| 2014 | $4,390 | $266,200 | $134,600 | $131,600 |
Source: Public Records
Map
Nearby Homes
- 42 Matfield St
- 386 Matfield St
- 18 American Ave
- 34 Captain Carlson Way
- Lot 1 Jeffrey Ln
- 6 Maddison
- 38 Leland St
- 6 Andrea Way
- 16 Friendship Dr
- 50 Belmont St
- 245-r Laurel St
- 92 Bryant St
- 505 N Central St
- 1 Thomas Cir
- 192 S Main St
- 281 Spring St
- 139 Geralynn Dr
- 1 Fairway Dr
- 21 Roosevelt Ave
- 324 W Union St
- 187 Matfield St
- 188 Matfield St
- 195 Matfield St
- 194 Matfield St
- 171 Matfield St
- 161 Matfield St
- 161 Matfield St Unit 1A
- 161 Matfield St Unit 1R
- 208 Matfield St
- 160 Matfield
- 1 Sandy Hill Rd
- 197 Matfield St
- 2 Norman Ave
- 3 Sandy Hill Rd
- 5 Sandy Hill Rd
- 157 Matfield St
- 6 Norman Ave
- LOT 4 Sandy Hill Rd
- LOT 2 Sandy Hill Rd
- 223 Matfield St