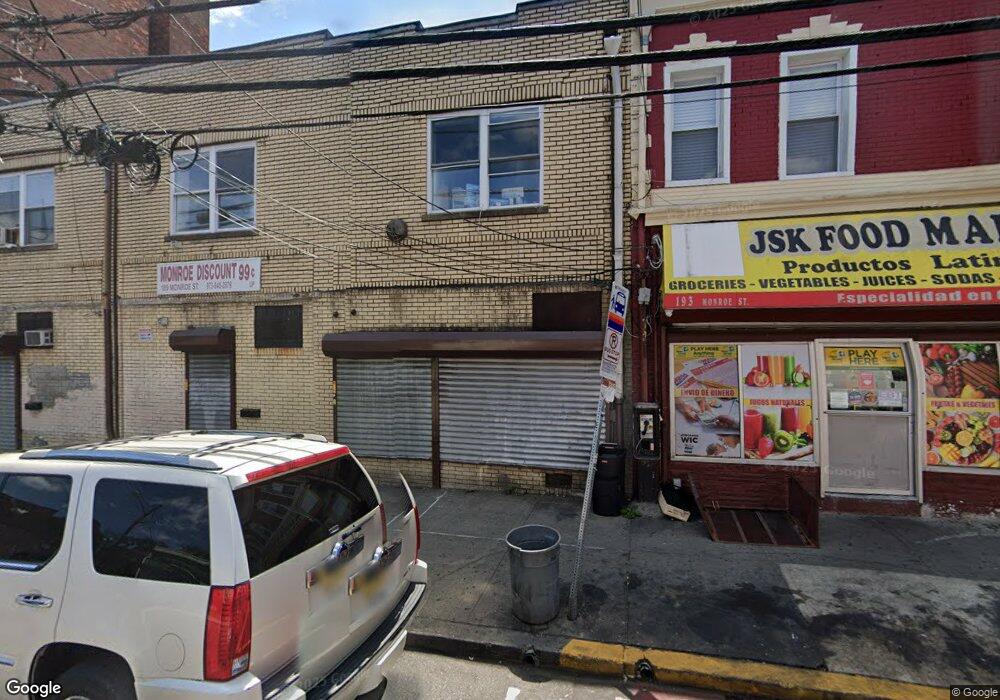
189 Monroe St Unit 1&2 Passaic, NJ 07055
Estimated Value: $604,000
--
Bed
--
Bath
15,000
Sq Ft
$40/Sq Ft
Est. Value
About This Home
This home is located at 189 Monroe St Unit 1&2, Passaic, NJ 07055 and is currently estimated at $604,000, approximately $40 per square foot. 189 Monroe St Unit 1&2 is a home located in Passaic County with nearby schools including Passaic High School # 12, Passaic Catholic Regional School, and Noble Leadership Academy.
Ownership History
Date
Name
Owned For
Owner Type
Purchase Details
Closed on
Mar 2, 2022
Sold by
189 Monroe Street Llc
Bought by
5 Starz Property Llc
Current Estimated Value
Purchase Details
Closed on
Nov 1, 2019
Sold by
Liu Hong and Liang Grace Yi
Bought by
189 Monroe Street Llc
Purchase Details
Closed on
Feb 2, 2011
Sold by
Liu Hong
Bought by
Liu Hong and Liang Grace Yi
Purchase Details
Closed on
Dec 6, 1999
Sold by
Wu Wei and Liu Hong
Bought by
Liu Hong
Purchase Details
Closed on
Oct 16, 1998
Sold by
J&S Realty Corp
Bought by
Wu Wei and Liu Hong
Create a Home Valuation Report for This Property
The Home Valuation Report is an in-depth analysis detailing your home's value as well as a comparison with similar homes in the area
Home Values in the Area
Average Home Value in this Area
Purchase History
| Date | Buyer | Sale Price | Title Company |
|---|---|---|---|
| 5 Starz Property Llc | $1,200,000 | Chicago Title | |
| 189 Monroe Street Llc | $575,000 | Sage Title & Setmnt Svcs Llc | |
| Liu Hong | -- | -- | |
| Liu Hong | $75,000 | -- | |
| Wu Wei | $75,000 | -- |
Source: Public Records
Tax History Compared to Growth
Tax History
| Year | Tax Paid | Tax Assessment Tax Assessment Total Assessment is a certain percentage of the fair market value that is determined by local assessors to be the total taxable value of land and additions on the property. | Land | Improvement |
|---|---|---|---|---|
| 2025 | $16,904 | $410,000 | $100,100 | $309,900 |
| 2024 | $16,416 | $410,000 | $100,100 | $309,900 |
| 2022 | $15,924 | $410,000 | $100,100 | $309,900 |
| 2021 | $15,416 | $410,000 | $100,100 | $309,900 |
| 2020 | $15,297 | $410,000 | $100,100 | $309,900 |
| 2019 | $15,076 | $410,000 | $100,100 | $309,900 |
| 2018 | $14,752 | $410,000 | $100,100 | $309,900 |
| 2017 | $14,297 | $410,000 | $100,100 | $309,900 |
| 2016 | $22,188 | $658,800 | $100,100 | $558,700 |
| 2015 | $10,239 | $135,200 | $63,800 | $71,400 |
| 2014 | $10,051 | $135,200 | $63,800 | $71,400 |
Source: Public Records
Map
Nearby Homes