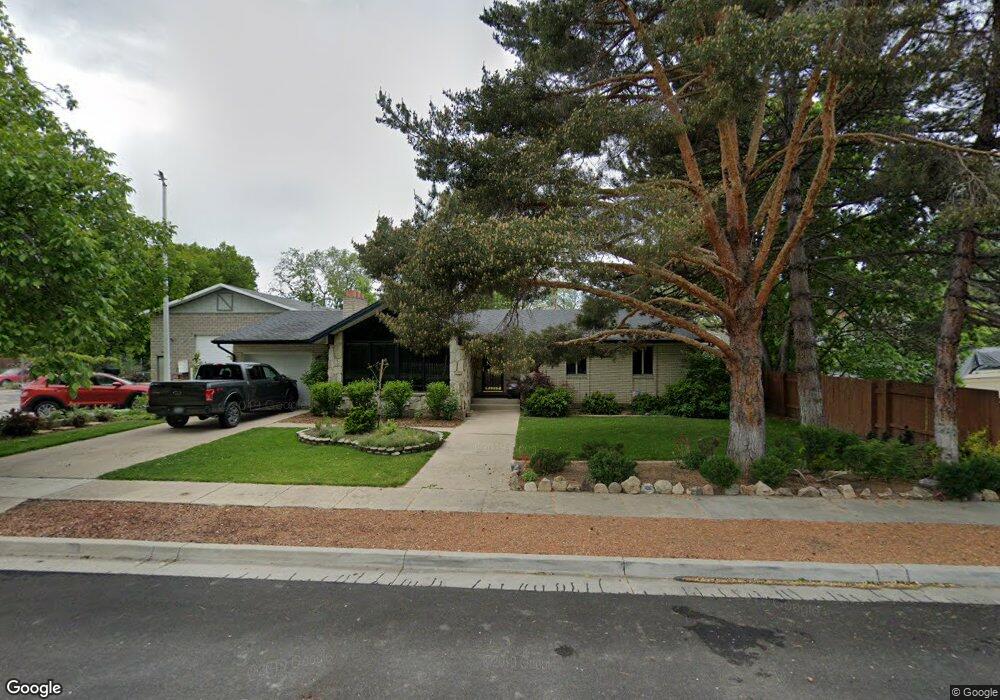
189 N 100 E Springville, UT 84663
Estimated Value: $513,000 - $528,000
6
Beds
3
Baths
2,980
Sq Ft
$175/Sq Ft
Est. Value
About This Home
This home is located at 189 N 100 E, Springville, UT 84663 and is currently estimated at $520,371, approximately $174 per square foot. 189 N 100 E is a home located in Utah County with nearby schools including Cherry Creek Elementary School, Springville Junior High School, and Springville High School.
Ownership History
Date
Name
Owned For
Owner Type
Purchase Details
Closed on
Jun 18, 2021
Sold by
Rasmussen Jon and Rasmussen Sandra
Bought by
Rasmussen Jon Casey and Rasmussen Sandra
Current Estimated Value
Home Financials for this Owner
Home Financials are based on the most recent Mortgage that was taken out on this home.
Original Mortgage
$269,500
Outstanding Balance
$243,999
Interest Rate
2.9%
Mortgage Type
New Conventional
Estimated Equity
$276,372
Purchase Details
Closed on
Sep 25, 2019
Sold by
Gurr Eugene J
Bought by
Rasmussen Jon and Rasmussen Sandra
Home Financials for this Owner
Home Financials are based on the most recent Mortgage that was taken out on this home.
Original Mortgage
$260,000
Interest Rate
3.6%
Mortgage Type
New Conventional
Create a Home Valuation Report for This Property
The Home Valuation Report is an in-depth analysis detailing your home's value as well as a comparison with similar homes in the area
Home Values in the Area
Average Home Value in this Area
Purchase History
| Date | Buyer | Sale Price | Title Company |
|---|---|---|---|
| Rasmussen Jon Casey | -- | Metro National Title | |
| Rasmussen Jon Casey | -- | Metro National Title | |
| Rasmussen Jon | -- | Stewart Title Ins Agcy Of Ut |
Source: Public Records
Mortgage History
| Date | Status | Borrower | Loan Amount |
|---|---|---|---|
| Open | Rasmussen Jon Casey | $269,500 | |
| Closed | Rasmussen Jon Casey | $269,500 | |
| Previous Owner | Rasmussen Jon | $260,000 |
Source: Public Records
Tax History
| Year | Tax Paid | Tax Assessment Tax Assessment Total Assessment is a certain percentage of the fair market value that is determined by local assessors to be the total taxable value of land and additions on the property. | Land | Improvement |
|---|---|---|---|---|
| 2025 | $2,336 | $267,630 | -- | -- |
| 2024 | $2,336 | $239,305 | $0 | $0 |
| 2023 | $2,224 | $228,085 | $0 | $0 |
| 2022 | $2,385 | $240,185 | $0 | $0 |
| 2021 | $2,143 | $335,900 | $91,000 | $244,900 |
| 2020 | $1,986 | $301,900 | $75,800 | $226,100 |
| 2019 | $1,911 | $295,700 | $72,300 | $223,400 |
| 2018 | $1,759 | $259,600 | $65,300 | $194,300 |
| 2017 | $1,782 | $139,700 | $0 | $0 |
| 2016 | $1,625 | $124,905 | $0 | $0 |
| 2015 | $1,502 | $118,030 | $0 | $0 |
| 2014 | $1,379 | $107,635 | $0 | $0 |
Source: Public Records
Map
Nearby Homes
Your Personal Tour Guide
Ask me questions while you tour the home.