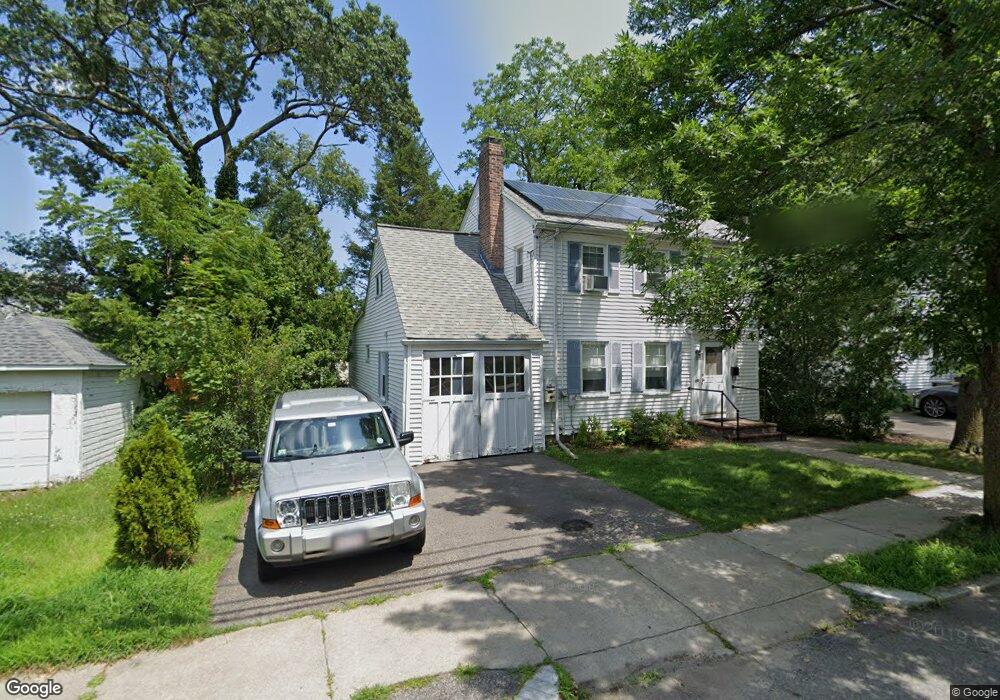
189 Perham St West Roxbury, MA 02132
West Roxbury NeighborhoodEstimated Value: $641,000 - $955,000
3
Beds
2
Baths
1,248
Sq Ft
$660/Sq Ft
Est. Value
About This Home
This home is located at 189 Perham St, West Roxbury, MA 02132 and is currently estimated at $823,909, approximately $660 per square foot. 189 Perham St is a home located in Suffolk County with nearby schools including St Theresa School, Holy Name Parish School, and Catholic Memorial School.
Ownership History
Date
Name
Owned For
Owner Type
Purchase Details
Closed on
Apr 28, 2010
Sold by
Oshea Eleanor M
Bought by
Brown Joseph E
Current Estimated Value
Home Financials for this Owner
Home Financials are based on the most recent Mortgage that was taken out on this home.
Original Mortgage
$402,116
Outstanding Balance
$270,445
Interest Rate
5.12%
Mortgage Type
FHA
Estimated Equity
$553,464
Purchase Details
Closed on
Mar 3, 2010
Sold by
Oshea Eleanor M and Lyon Patricia
Bought by
Oshea Eleanor M
Home Financials for this Owner
Home Financials are based on the most recent Mortgage that was taken out on this home.
Original Mortgage
$402,116
Outstanding Balance
$270,445
Interest Rate
5.12%
Mortgage Type
FHA
Estimated Equity
$553,464
Create a Home Valuation Report for This Property
The Home Valuation Report is an in-depth analysis detailing your home's value as well as a comparison with similar homes in the area
Home Values in the Area
Average Home Value in this Area
Purchase History
We collect this data history from publicly available records. To have your information removed, we recommend requesting removal directly through your county’s website.
| Date | Buyer | Sale Price | Title Company |
|---|---|---|---|
| Brown Joseph E | $416,000 | -- | |
| Oshea Eleanor M | -- | -- |
Source: Public Records
Mortgage History
We collect this data history from publicly available records. To have your information removed, we recommend requesting removal directly through your county’s website.
| Date | Status | Borrower | Loan Amount |
|---|---|---|---|
| Open | Brown Joseph E | $402,116 |
Source: Public Records
Tax History
| Year | Tax Paid | Tax Assessment Tax Assessment Total Assessment is a certain percentage of the fair market value that is determined by local assessors to be the total taxable value of land and additions on the property. | Land | Improvement |
|---|---|---|---|---|
| 2025 | $7,754 | $669,600 | $218,500 | $451,100 |
| 2024 | $6,506 | $596,900 | $221,600 | $375,300 |
| 2023 | $6,105 | $568,400 | $211,000 | $357,400 |
| 2022 | $5,623 | $516,800 | $191,900 | $324,900 |
| 2021 | $5,230 | $490,200 | $188,100 | $302,100 |
| 2020 | $4,951 | $468,800 | $170,200 | $298,600 |
| 2019 | $4,705 | $446,400 | $142,800 | $303,600 |
| 2018 | $4,332 | $413,400 | $142,800 | $270,600 |
| 2017 | $4,290 | $405,100 | $142,800 | $262,300 |
| 2016 | $4,326 | $393,300 | $142,800 | $250,500 |
| 2015 | $4,549 | $375,600 | $167,600 | $208,000 |
| 2014 | $4,458 | $354,400 | $167,600 | $186,800 |
Source: Public Records
Map
Nearby Homes
- 177 Perham St
- 161 Perham St
- 130 Perham St
- 460 Baker St
- 11 Sherbrook St
- 186 Temple St
- 73 Dent St Unit 2
- 481 Lagrange St
- 89 Newfield St
- 84 Hastings St
- 1 Furbush Rd
- 3 Vermont St
- 52 Park St
- 45 Bonair St
- 1216 Vfw Pkwy Unit 40
- 829 Lagrange St Unit 3
- 1210 Vfw Pkwy Unit 11
- 96 Anderer Ln Unit 5
- 7 Long Terrace
- 100 Anderer Ln Unit 2
Your Personal Tour Guide
Ask me questions while you tour the home.