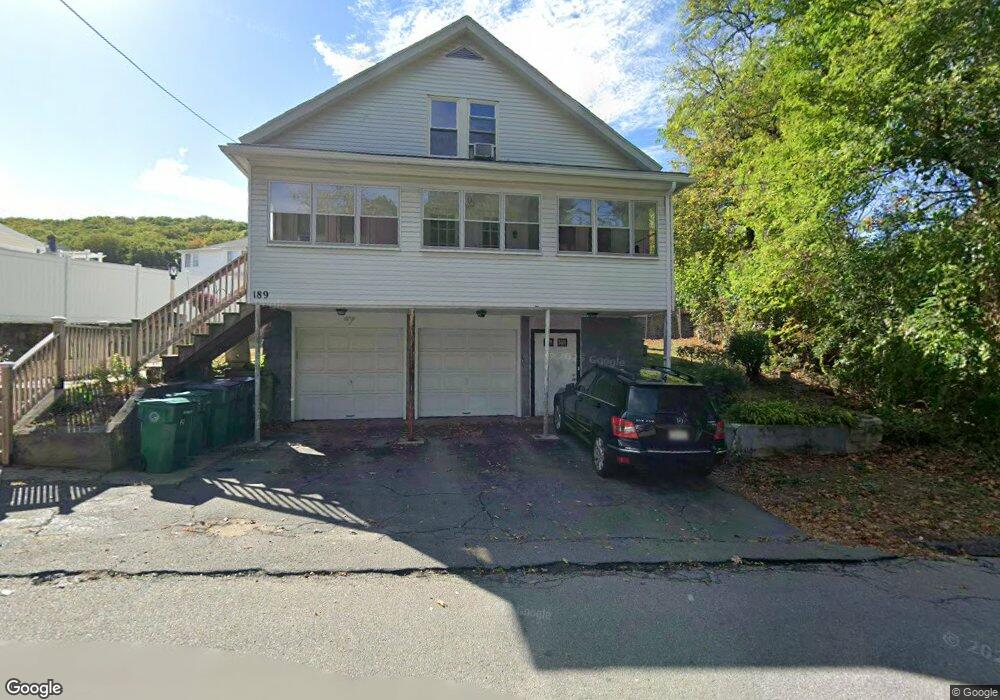
189 Rollstone St Fitchburg, MA 01420
Estimated Value: $395,000 - $436,000
3
Beds
2
Baths
1,539
Sq Ft
$273/Sq Ft
Est. Value
About This Home
This home is located at 189 Rollstone St, Fitchburg, MA 01420 and is currently estimated at $420,856, approximately $273 per square foot. 189 Rollstone St is a home located in Worcester County with nearby schools including South Street Elementary School, Crocker Elementary School, and Reingold Elementary School.
Ownership History
Date
Name
Owned For
Owner Type
Purchase Details
Closed on
Jan 13, 2003
Sold by
Parker Amy M
Bought by
Flowers Lisa M
Current Estimated Value
Home Financials for this Owner
Home Financials are based on the most recent Mortgage that was taken out on this home.
Original Mortgage
$166,500
Outstanding Balance
$71,910
Interest Rate
6.19%
Mortgage Type
Purchase Money Mortgage
Estimated Equity
$348,946
Purchase Details
Closed on
Sep 27, 1996
Sold by
Koutonen John W and Koutonen Tracy M
Bought by
Lemieux Paul L and Lemieux Audrey A
Home Financials for this Owner
Home Financials are based on the most recent Mortgage that was taken out on this home.
Original Mortgage
$65,000
Interest Rate
7.83%
Mortgage Type
Purchase Money Mortgage
Create a Home Valuation Report for This Property
The Home Valuation Report is an in-depth analysis detailing your home's value as well as a comparison with similar homes in the area
Home Values in the Area
Average Home Value in this Area
Purchase History
| Date | Buyer | Sale Price | Title Company |
|---|---|---|---|
| Flowers Lisa M | $185,000 | -- | |
| Lemieux Paul L | $65,000 | -- |
Source: Public Records
Mortgage History
| Date | Status | Borrower | Loan Amount |
|---|---|---|---|
| Open | Lemieux Paul L | $166,500 | |
| Previous Owner | Lemieux Paul L | $65,000 |
Source: Public Records
Tax History Compared to Growth
Tax History
| Year | Tax Paid | Tax Assessment Tax Assessment Total Assessment is a certain percentage of the fair market value that is determined by local assessors to be the total taxable value of land and additions on the property. | Land | Improvement |
|---|---|---|---|---|
| 2025 | $47 | $347,600 | $86,100 | $261,500 |
| 2024 | $4,216 | $284,700 | $51,200 | $233,500 |
| 2023 | $3,826 | $238,800 | $39,300 | $199,500 |
| 2022 | $3,888 | $220,800 | $36,900 | $183,900 |
| 2021 | $4,270 | $184,100 | $26,200 | $157,900 |
| 2020 | $3,266 | $165,700 | $21,500 | $144,200 |
| 2019 | $3,078 | $150,200 | $29,800 | $120,400 |
| 2018 | $2,685 | $127,800 | $27,400 | $100,400 |
| 2017 | $2,446 | $113,800 | $25,000 | $88,800 |
| 2016 | $2,416 | $113,800 | $25,000 | $88,800 |
| 2015 | $2,353 | $113,800 | $26,200 | $87,600 |
| 2014 | $2,253 | $113,600 | $26,200 | $87,400 |
Source: Public Records
Map
Nearby Homes