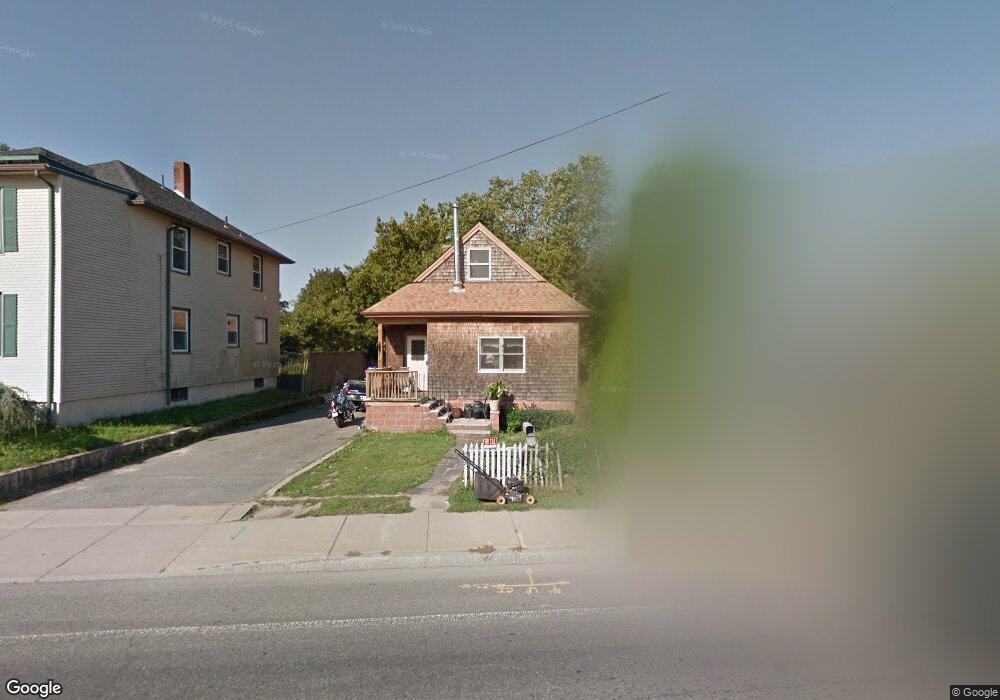
189 S Main St Acushnet, MA 02743
Estimated Value: $338,000 - $455,000
2
Beds
1
Bath
1,318
Sq Ft
$293/Sq Ft
Est. Value
About This Home
This home is located at 189 S Main St, Acushnet, MA 02743 and is currently estimated at $386,143, approximately $292 per square foot. 189 S Main St is a home located in Bristol County with nearby schools including Acushnet Elementary School, Albert F Ford Middle School, and Alma Del Mar Charter School.
Ownership History
Date
Name
Owned For
Owner Type
Purchase Details
Closed on
Jun 12, 2024
Sold by
Boissoneau Suzanne A
Bought by
Suzanne A Boissoneau T A and Suzanne Boissneau
Current Estimated Value
Purchase Details
Closed on
Mar 27, 2009
Sold by
Boissoneau Raymond A
Bought by
Boissoneau Raymond A and Boissoneau Suzanne A
Create a Home Valuation Report for This Property
The Home Valuation Report is an in-depth analysis detailing your home's value as well as a comparison with similar homes in the area
Home Values in the Area
Average Home Value in this Area
Purchase History
| Date | Buyer | Sale Price | Title Company |
|---|---|---|---|
| Suzanne A Boissoneau T A | -- | None Available | |
| Suzanne A Boissoneau T A | -- | None Available | |
| Boissoneau Raymond A | -- | -- | |
| Boissoneau Raymond A | -- | -- |
Source: Public Records
Mortgage History
| Date | Status | Borrower | Loan Amount |
|---|---|---|---|
| Previous Owner | Boissoneau Raymond A | $27,000 | |
| Previous Owner | Boissoneau Raymond A | $15,000 | |
| Previous Owner | Boissoneau Raymond A | $45,000 |
Source: Public Records
Tax History
| Year | Tax Paid | Tax Assessment Tax Assessment Total Assessment is a certain percentage of the fair market value that is determined by local assessors to be the total taxable value of land and additions on the property. | Land | Improvement |
|---|---|---|---|---|
| 2025 | $31 | $286,000 | $91,600 | $194,400 |
| 2024 | $3,017 | $264,400 | $87,400 | $177,000 |
| 2023 | $2,856 | $238,000 | $78,900 | $159,100 |
| 2022 | $2,816 | $212,200 | $74,600 | $137,600 |
| 2021 | $2,669 | $193,000 | $74,600 | $118,400 |
| 2020 | $2,439 | $193,000 | $74,600 | $118,400 |
| 2019 | $2,440 | $172,100 | $66,100 | $106,000 |
| 2018 | $2,938 | $172,100 | $66,100 | $106,000 |
| 2017 | $2,115 | $162,300 | $66,100 | $96,200 |
| 2016 | $2,374 | $163,400 | $66,100 | $97,300 |
| 2015 | $2,252 | $157,700 | $66,100 | $91,600 |
Source: Public Records
Map
Nearby Homes
- 11 Boylston St
- 12 Hayes St Unit 1
- 14 Hayes St Unit 1
- 12 White St
- 0 Hathaway Rd Unit 73469544
- 122 Truro St
- 91 S Main St
- 81 Sylvia St
- 23 Oliveira Ave
- 25 Pershing Ave
- 34 Chicopee St
- 14 Caswell St
- 15 Ball St
- 112 Lawson Ave
- 27 Meadow Ln
- 65 Armsby St
- 1940-1942 Acushnet Ave
- 20 Jake Ln
- 4 Sam St
- 5 William St
Your Personal Tour Guide
Ask me questions while you tour the home.