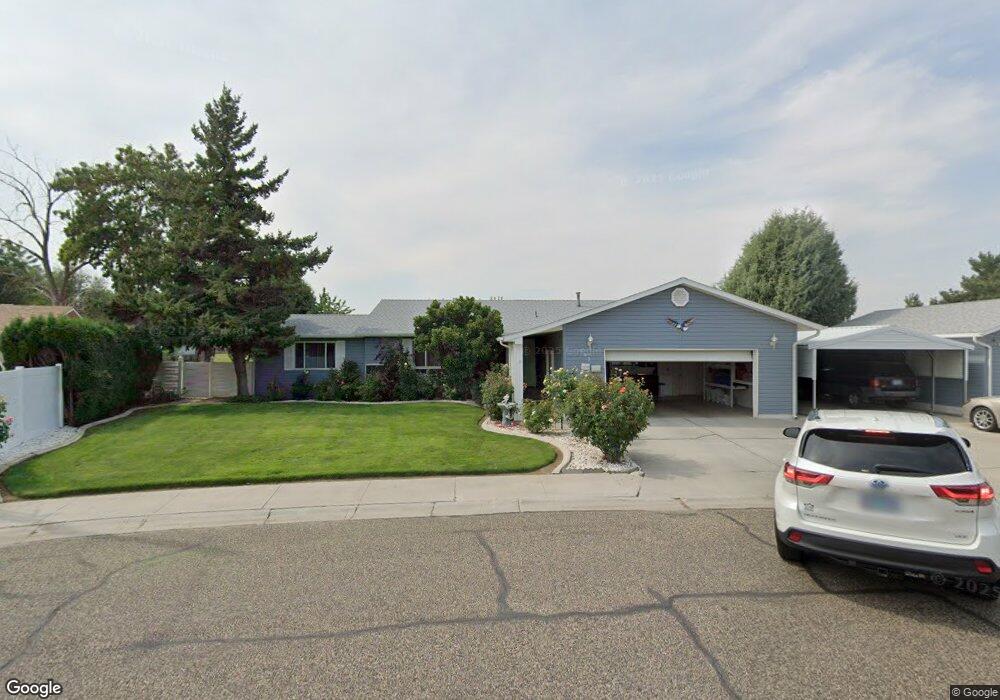
189 SW 26th St Ontario, OR 97914
Estimated Value: $359,000 - $423,000
3
Beds
2
Baths
1,860
Sq Ft
$206/Sq Ft
Est. Value
About This Home
This home is located at 189 SW 26th St, Ontario, OR 97914 and is currently estimated at $383,169, approximately $206 per square foot. 189 SW 26th St is a home located in Malheur County with nearby schools including Ontario High School, Four Rivers Community School, and Treasure Valley Christian School.
Ownership History
Date
Name
Owned For
Owner Type
Purchase Details
Closed on
Jun 18, 2025
Sold by
Mclellan Eileen K Harper
Bought by
Eileen Mclellan Harper Entities Trust and Mclellan
Current Estimated Value
Purchase Details
Closed on
Dec 17, 2024
Sold by
Church Of The Nazarene Of Vale Oregon
Bought by
Wheeler Edwin and Wheeler Charla G
Purchase Details
Closed on
Mar 15, 2023
Sold by
Cruickshank Scott
Bought by
Scott Cruickshank Trust and Cruickshank
Purchase Details
Closed on
Jan 27, 2023
Sold by
Keppinger John
Bought by
Keppinger Johnny
Purchase Details
Closed on
Dec 21, 2011
Sold by
Oregon Concrete Llc
Bought by
Seubert Excavators Inc and Clearwater Concreter Inc
Purchase Details
Closed on
Nov 2, 2008
Sold by
Bokides Mary G and Bokides Mary
Bought by
Bokides Properties Llc
Create a Home Valuation Report for This Property
The Home Valuation Report is an in-depth analysis detailing your home's value as well as a comparison with similar homes in the area
Home Values in the Area
Average Home Value in this Area
Purchase History
| Date | Buyer | Sale Price | Title Company |
|---|---|---|---|
| Eileen Mclellan Harper Entities Trust | -- | None Listed On Document | |
| Wheeler Edwin | $250,000 | Amerititle | |
| Wheeler Edwin | $250,000 | Amerititle | |
| Scott Cruickshank Trust | -- | None Listed On Document | |
| Keppinger Johnny | $160,000 | First American Title | |
| Keppinger John | -- | -- | |
| Seubert Excavators Inc | $430,709 | None Available | |
| Bokides Properties Llc | -- | -- |
Source: Public Records
Tax History Compared to Growth
Tax History
| Year | Tax Paid | Tax Assessment Tax Assessment Total Assessment is a certain percentage of the fair market value that is determined by local assessors to be the total taxable value of land and additions on the property. | Land | Improvement |
|---|---|---|---|---|
| 2024 | $3,301 | $214,550 | $56,158 | $158,392 |
| 2023 | $3,214 | $208,301 | $51,469 | $156,832 |
| 2022 | $3,129 | $202,234 | $57,990 | $144,244 |
| 2021 | $3,049 | $196,344 | $60,582 | $135,762 |
| 2020 | $2,967 | $190,626 | $58,446 | $132,180 |
| 2019 | $2,890 | $185,074 | $47,287 | $137,787 |
| 2018 | $2,631 | $179,684 | $47,264 | $132,420 |
| 2017 | $2,551 | $174,451 | $50,419 | $124,032 |
| 2016 | $2,488 | $169,370 | $48,950 | $120,420 |
| 2015 | $2,467 | $166,334 | $50,419 | $115,915 |
| 2014 | $2,383 | $161,490 | $48,950 | $112,540 |
Source: Public Records
Map
Nearby Homes
- 2578 SW 2nd Ave
- 2562 Lauren Dr
- 2543 Lauren Dr
- 41 N Dorian Dr
- 1921 Arcata Way
- 49 NW 19th St
- 1863 SW 1st Ave
- 2048 NW 3rd Ave
- 335 NW 19th St
- 770 N Dorian Dr
- 563 NW 18th St
- 1488 W Idaho Ave
- 1425 W Idaho Ave
- 247 SW 13th St
- 655 NW 15th St
- 5387 Oregon 201
- TBD Malheur Dr
- 3335 NW 4th Ave
- 658 NW 14th St
- 1371 SW 11th Ave
- 158 SW 26th St
- 2561 SW 2nd Ave
- 2594 SW 2nd Ave
- 109 SW 26th St
- 122 SW 26th St
- 2535 SW 2nd Ave
- 2556 SW 2nd Ave
- 2568 SW 1st Ave
- 73 SW 26th St
- 2532 SW 2nd Ave
- 2595 SW 1st Ave
- 191 SW 25th St
- 2571 SW 1st Ave
- 2528 SW 1st Ave
- 2510 SW 2nd Ave
- 151 SW 25th St
- 17 SW 26th St
- 2537 SW 1st Ave
- 2592 W Idaho Ave
- 2496 SW 2nd Ave