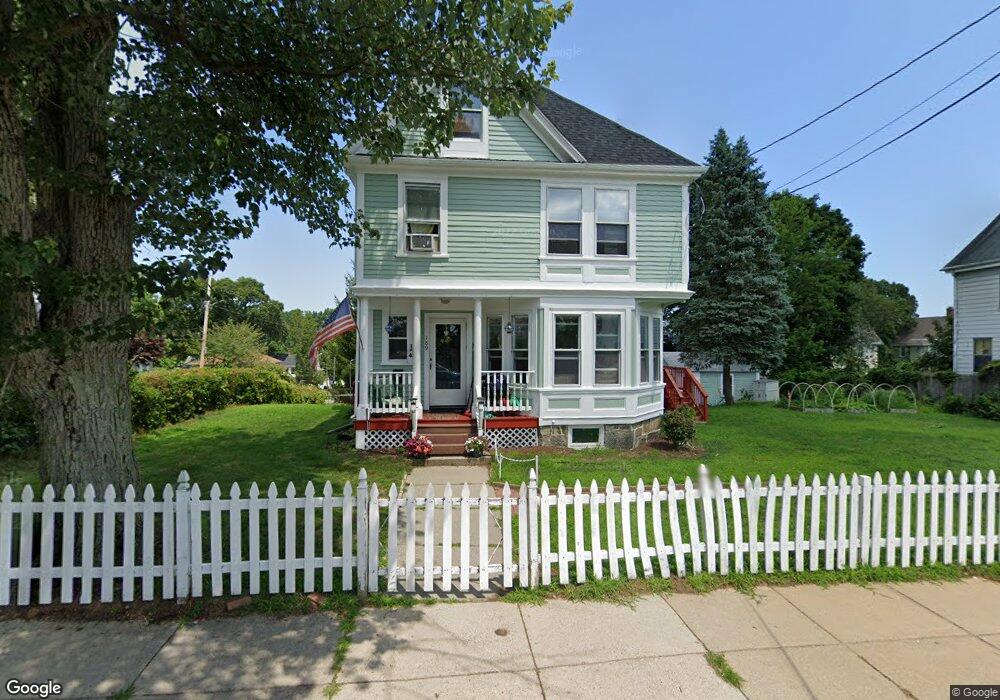
189 Temple St West Roxbury, MA 02132
West Roxbury NeighborhoodEstimated Value: $814,000 - $990,000
5
Beds
1
Bath
1,881
Sq Ft
$470/Sq Ft
Est. Value
About This Home
This home is located at 189 Temple St, West Roxbury, MA 02132 and is currently estimated at $883,844, approximately $469 per square foot. 189 Temple St is a home located in Suffolk County with nearby schools including Brooke Charter School Roslindale, Academy of the Pacific Rim Charter Public School, and Boston Preparatory Charter Public School.
Ownership History
Date
Name
Owned For
Owner Type
Purchase Details
Closed on
Mar 27, 1997
Sold by
Temple Street Rt 189
Bought by
Obrien Michael J and Hurley Mary E
Current Estimated Value
Create a Home Valuation Report for This Property
The Home Valuation Report is an in-depth analysis detailing your home's value as well as a comparison with similar homes in the area
Home Values in the Area
Average Home Value in this Area
Purchase History
| Date | Buyer | Sale Price | Title Company |
|---|---|---|---|
| Obrien Michael J | $80,000 | -- |
Source: Public Records
Mortgage History
| Date | Status | Borrower | Loan Amount |
|---|---|---|---|
| Open | Obrien Michael J | $250,000 | |
| Closed | Obrien Michael J | $200,000 | |
| Closed | Obrien Michael J | $185,000 | |
| Closed | Obrien Michael J | $140,000 |
Source: Public Records
Tax History Compared to Growth
Tax History
| Year | Tax Paid | Tax Assessment Tax Assessment Total Assessment is a certain percentage of the fair market value that is determined by local assessors to be the total taxable value of land and additions on the property. | Land | Improvement |
|---|---|---|---|---|
| 2025 | $9,149 | $790,100 | $286,100 | $504,000 |
| 2024 | $8,158 | $748,400 | $297,100 | $451,300 |
| 2023 | $7,655 | $712,800 | $283,000 | $429,800 |
| 2022 | $7,049 | $647,900 | $257,200 | $390,700 |
| 2021 | $6,603 | $618,800 | $252,200 | $366,600 |
| 2020 | $6,307 | $597,300 | $225,400 | $371,900 |
| 2019 | $5,988 | $568,100 | $198,200 | $369,900 |
| 2018 | $5,512 | $526,000 | $198,200 | $327,800 |
| 2017 | $5,459 | $515,500 | $198,200 | $317,300 |
| 2016 | $5,504 | $500,400 | $198,200 | $302,200 |
| 2015 | $5,816 | $480,300 | $208,400 | $271,900 |
| 2014 | $5,700 | $453,100 | $208,400 | $244,700 |
Source: Public Records
Map
Nearby Homes
- 183 Temple St
- 59 Chesbrough Rd
- 105 Chesbrough Rd
- 73 Dent St Unit 1
- 28 Dow Rd
- 539 Lagrange St
- 340 Baker St Unit 1
- 331 Vermont St
- 14 Sanborn Ave
- 9 Carroll St
- 76 Potomac St
- 27-29 Temple St
- 1216 Vfw Pkwy Unit 40
- 425 Lagrange St Unit 203
- 1214 Vfw Pkwy Unit 30
- 1214 Vfw Pkwy Unit 37
- 76 Vermont St
- 89 Dwinell St
- 577 Baker St Unit 577
- 37 Hastings St Unit 103