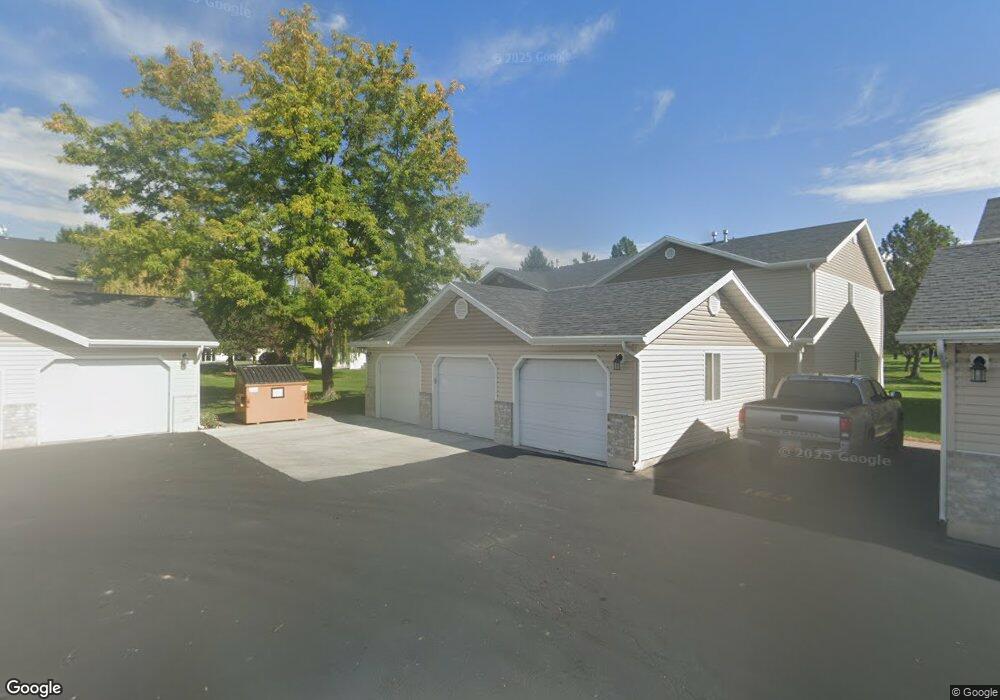
189 W 1250 S Logan, UT 84321
Woodruff NeighborhoodEstimated Value: $260,136 - $266,000
Studio
--
Bath
1,190
Sq Ft
$220/Sq Ft
Est. Value
About This Home
This home is located at 189 W 1250 S, Logan, UT 84321 and is currently estimated at $262,284, approximately $220 per square foot. 189 W 1250 S is a home with nearby schools including Hillcrest Elementary School, Mount Logan Middle School, and Logan High School.
Ownership History
Date
Name
Owned For
Owner Type
Purchase Details
Closed on
Nov 20, 2020
Sold by
Hoffmann Jennifer L and Hoffmann Allan Jeffrey
Bought by
Hoffmann Jennifer Lea and Jennifer Lea Hoffman Living Tr
Current Estimated Value
Purchase Details
Closed on
Jun 28, 2017
Sold by
Hoffmann Jennifer L
Bought by
Hoffmann Jennifer L and Allan Jeffrey R
Purchase Details
Closed on
Oct 23, 2001
Sold by
Hoffmann Jennifer and Allan Jeffery R
Bought by
Hoffmann Jennifer and Allan Jeffrey R
Home Financials for this Owner
Home Financials are based on the most recent Mortgage that was taken out on this home.
Original Mortgage
$35,000
Interest Rate
6.12%
Purchase Details
Closed on
Sep 25, 2001
Sold by
Autologous Investment & Research Lc
Bought by
Hoffmann Jennifer and Allan Jeffery R
Home Financials for this Owner
Home Financials are based on the most recent Mortgage that was taken out on this home.
Original Mortgage
$35,000
Interest Rate
6.12%
Create a Home Valuation Report for This Property
The Home Valuation Report is an in-depth analysis detailing your home's value as well as a comparison with similar homes in the area
Home Values in the Area
Average Home Value in this Area
Purchase History
| Date | Buyer | Sale Price | Title Company |
|---|---|---|---|
| Hoffmann Jennifer Lea | -- | None Available | |
| Hoffmann Jennifer L | -- | None Available | |
| Hoffmann Jennifer | -- | Northern Title Company | |
| Hoffmann Jennifer | -- | Northern Title Company |
Source: Public Records
Mortgage History
| Date | Status | Borrower | Loan Amount |
|---|---|---|---|
| Previous Owner | Hoffmann Jennifer | $35,000 |
Source: Public Records
Tax History
| Year | Tax Paid | Tax Assessment Tax Assessment Total Assessment is a certain percentage of the fair market value that is determined by local assessors to be the total taxable value of land and additions on the property. | Land | Improvement |
|---|---|---|---|---|
| 2025 | $1,078 | $139,435 | $0 | $0 |
| 2024 | $1,148 | $143,745 | $0 | $0 |
| 2023 | $1,274 | $152,120 | $0 | $0 |
| 2022 | $1,431 | $159,500 | $0 | $0 |
| 2021 | $1,155 | $198,890 | $50,000 | $148,890 |
| 2020 | $997 | $154,600 | $30,000 | $124,600 |
| 2019 | $925 | $137,272 | $30,000 | $107,272 |
| 2018 | $910 | $123,280 | $30,000 | $93,280 |
| 2017 | $805 | $57,640 | $0 | $0 |
| 2016 | $835 | $47,905 | $0 | $0 |
| 2015 | $692 | $47,745 | $0 | $0 |
| 2014 | $626 | $47,745 | $0 | $0 |
| 2013 | -- | $47,745 | $0 | $0 |
Source: Public Records
Map
Nearby Homes
- 137 W 1309 S
- 1556 Talon Dr
- 409 W 3085 S
- 1024 S 270 W
- 593 W 300 S
- 238 W 1010 S Unit 43
- 233 W 1010 S
- 473 W 40 S Unit H102
- 472 W 40 S Unit 203
- 472 W 40 S Unit 102
- 460 W 15 S Unit G202
- 470 W 15 S Unit F301
- 460 W 15 S Unit G201
- 462 W 40 S Unit 202
- 462 W 40 S Unit 203
- 10 S 410 W
- 262 S 485 W
- 513 W 400 S Unit 54
- 265 S 375 W
- 178 Riverwalk Cir
Your Personal Tour Guide
Ask me questions while you tour the home.