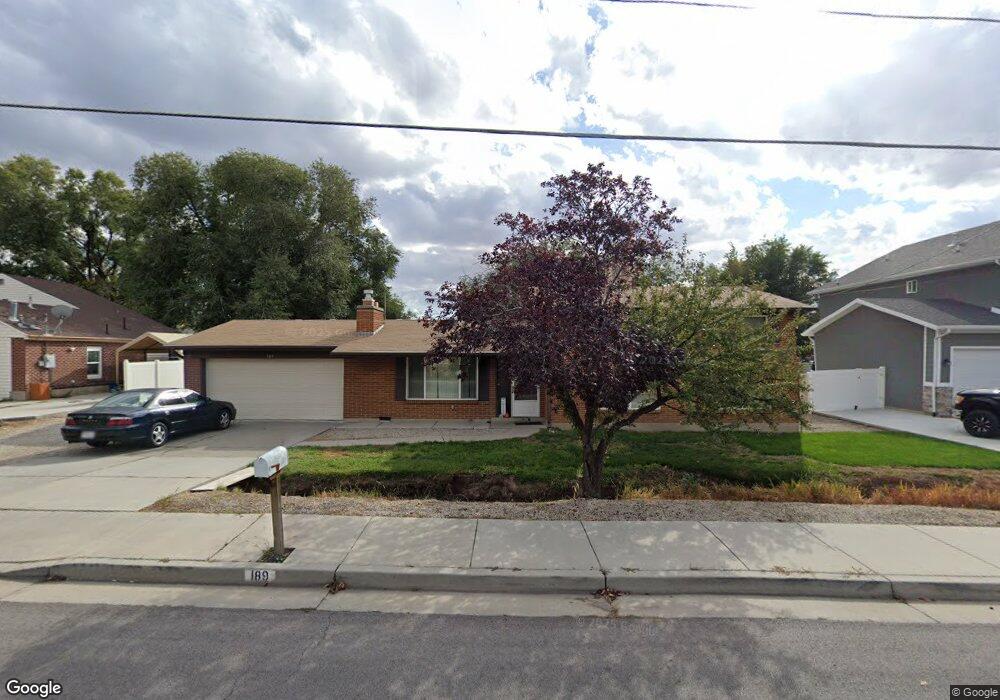
189 W 8600 S Midvale, UT 84047
Estimated Value: $512,000 - $569,000
4
Beds
2
Baths
2,028
Sq Ft
$264/Sq Ft
Est. Value
About This Home
This home is located at 189 W 8600 S, Midvale, UT 84047 and is currently estimated at $534,953, approximately $263 per square foot. 189 W 8600 S is a home located in Salt Lake County with nearby schools including Copperview Elementary School, Midvale Middle School, and Jordan High.
Ownership History
Date
Name
Owned For
Owner Type
Purchase Details
Closed on
Nov 21, 2019
Sold by
Oz Development Llc
Bought by
Barlow Doran Bradley and Barlow Alice Carrie
Current Estimated Value
Home Financials for this Owner
Home Financials are based on the most recent Mortgage that was taken out on this home.
Original Mortgage
$153,000
Outstanding Balance
$134,331
Interest Rate
3.5%
Estimated Equity
$400,622
Purchase Details
Closed on
Aug 27, 2019
Sold by
Watchman Lawrence W
Bought by
Oz Development Llc
Purchase Details
Closed on
Aug 14, 2013
Sold by
Morrison Dianne J and Gilden Susan Judd
Bought by
Watchman Lawrence W
Home Financials for this Owner
Home Financials are based on the most recent Mortgage that was taken out on this home.
Original Mortgage
$190,918
Interest Rate
4.33%
Mortgage Type
VA
Purchase Details
Closed on
Nov 14, 1997
Sold by
Robwood Industries
Bought by
Westover Reese Humble
Purchase Details
Closed on
Apr 23, 1986
Sold by
Johnson Mabel S
Bought by
Westover Reese H and Westover Mary Lucille
Create a Home Valuation Report for This Property
The Home Valuation Report is an in-depth analysis detailing your home's value as well as a comparison with similar homes in the area
Home Values in the Area
Average Home Value in this Area
Purchase History
| Date | Buyer | Sale Price | Title Company |
|---|---|---|---|
| Barlow Doran Bradley | -- | Backman Title Services | |
| Oz Development Llc | -- | Meridian Title | |
| Watchman Lawrence W | -- | Security Title Of Davis Co | |
| Westover Reese Humble | -- | -- | |
| Westover Reese H | -- | -- |
Source: Public Records
Mortgage History
| Date | Status | Borrower | Loan Amount |
|---|---|---|---|
| Open | Barlow Doran Bradley | $153,000 | |
| Previous Owner | Watchman Lawrence W | $190,918 |
Source: Public Records
Tax History Compared to Growth
Tax History
| Year | Tax Paid | Tax Assessment Tax Assessment Total Assessment is a certain percentage of the fair market value that is determined by local assessors to be the total taxable value of land and additions on the property. | Land | Improvement |
|---|---|---|---|---|
| 2025 | $2,826 | $461,100 | $138,500 | $322,600 |
| 2024 | $2,826 | $464,500 | $153,200 | $311,300 |
| 2023 | $2,581 | $420,200 | $145,700 | $274,500 |
| 2022 | $2,725 | $433,100 | $142,800 | $290,300 |
| 2021 | $2,412 | $328,300 | $107,400 | $220,900 |
| 2020 | $2,306 | $296,800 | $107,400 | $189,400 |
| 2019 | $1,635 | $205,100 | $101,300 | $103,800 |
| 2018 | $1,582 | $200,500 | $101,300 | $99,200 |
| 2017 | $2,030 | $192,500 | $101,300 | $91,200 |
| 2016 | $1,618 | $191,300 | $101,300 | $90,000 |
| 2015 | $1,894 | $187,100 | $98,200 | $88,900 |
| 2014 | $1,609 | $178,500 | $95,200 | $83,300 |
Source: Public Records
Map
Nearby Homes
- 118 W 8600 S
- 231 Amanda Lynn Ln
- 71 W Princeton Dr
- 59 W Princeton Dr
- 8331 S Monroe St
- 27 W Princeton Dr
- 21 E 8680 S
- 8296 Jackson St
- 8279 S Jackson St
- 8269 S Roosevelt St
- 8950 S Reliance Dr
- 56 Apollo Way
- 110 E Main St
- 8772 S 120 E
- 149 E Pioneer Ave
- 139 W Columbia Dr
- 74 E Resaca Dr Unit B12
- 139 E Abbeville Ct
- 132 E Chambord Ct
- 8953 S 90 E