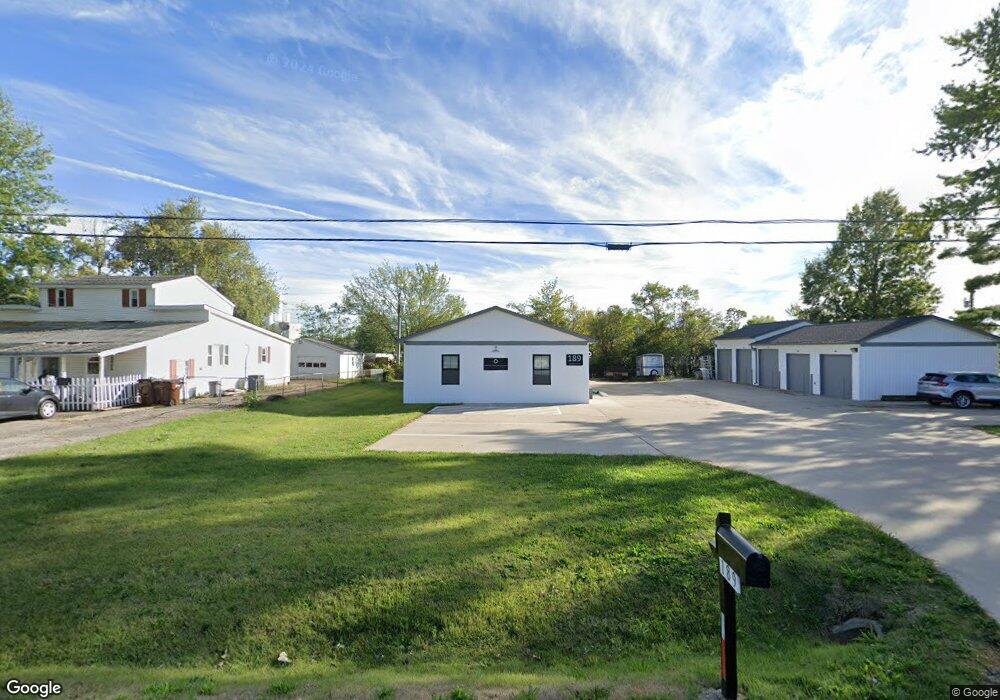
189 Weber Ln Florence, KY 41042
Estimated Value: $219,000 - $278,000
3
Beds
1
Bath
1,296
Sq Ft
$194/Sq Ft
Est. Value
About This Home
This home is located at 189 Weber Ln, Florence, KY 41042 and is currently estimated at $251,096, approximately $193 per square foot. 189 Weber Ln is a home located in Boone County with nearby schools including Hillard Collins Elementary School, Jones Middle School, and Boone County High School.
Ownership History
Date
Name
Owned For
Owner Type
Purchase Details
Closed on
Nov 27, 2021
Sold by
Steeplechase Development Llc
Bought by
Fischer Single Family Homes Iv
Current Estimated Value
Purchase Details
Closed on
Jul 6, 2021
Sold by
Steeplechase Development Llc
Bought by
Fischer Single Family Homes Iv Llc
Purchase Details
Closed on
Jan 20, 2016
Sold by
Pugh Malcolm
Bought by
Phb Properties Llc
Home Financials for this Owner
Home Financials are based on the most recent Mortgage that was taken out on this home.
Original Mortgage
$85,000
Interest Rate
6.87%
Mortgage Type
Adjustable Rate Mortgage/ARM
Purchase Details
Closed on
Sep 23, 2015
Sold by
County Of Boone
Bought by
Pugh Malcolm and The 189 Weber Lane Trust
Purchase Details
Closed on
Sep 9, 2009
Sold by
Darby Frederick J
Bought by
Pugh Malcolm and 189 Weber Lane Trust
Purchase Details
Closed on
May 3, 1995
Sold by
Frilling John J
Bought by
Frederick J Darby
Create a Home Valuation Report for This Property
The Home Valuation Report is an in-depth analysis detailing your home's value as well as a comparison with similar homes in the area
Home Values in the Area
Average Home Value in this Area
Purchase History
| Date | Buyer | Sale Price | Title Company |
|---|---|---|---|
| Fischer Single Family Homes Iv | $49,000 | Ziegler & Schneider Psc | |
| Fischer Single Family Homes Iv Llc | $49,000 | None Available | |
| Phb Properties Llc | -- | Kentucky Land Title Agency | |
| Pugh Malcolm | $500 | None Available | |
| Pugh Malcolm | $65,000 | None Available | |
| Frederick J Darby | $54,000 | -- |
Source: Public Records
Mortgage History
| Date | Status | Borrower | Loan Amount |
|---|---|---|---|
| Previous Owner | Phb Properties Llc | $85,000 | |
| Closed | Frederick J Darby | -- |
Source: Public Records
Tax History Compared to Growth
Tax History
| Year | Tax Paid | Tax Assessment Tax Assessment Total Assessment is a certain percentage of the fair market value that is determined by local assessors to be the total taxable value of land and additions on the property. | Land | Improvement |
|---|---|---|---|---|
| 2024 | $2,812 | $259,800 | $64,000 | $195,800 |
| 2023 | $2,840 | $259,800 | $64,000 | $195,800 |
| 2022 | $2,195 | $200,000 | $64,000 | $136,000 |
| 2021 | $2,275 | $200,000 | $64,000 | $136,000 |
| 2020 | $2,240 | $200,000 | $64,000 | $136,000 |
| 2019 | $2,257 | $200,000 | $64,000 | $136,000 |
| 2018 | $2,257 | $200,000 | $64,000 | $136,000 |
| 2017 | $2,196 | $200,000 | $64,000 | $136,000 |
| 2015 | $784 | $74,000 | $15,000 | $59,000 |
| 2013 | -- | $65,000 | $12,000 | $53,000 |
Source: Public Records
Map
Nearby Homes
- 10124 Carnation Ct Unit 4
- 10160 Carnation Ct Unit 5
- 460 Marian Ln Unit 3
- 4245 Briarwood Dr Unit 1
- 4263 Ashgrove Ct
- 10354 Frank Duke Blvd
- 10474 Remy Ln
- 10266 Knob Hill Dr
- 1079 Birch Tree Ln
- 8492 Watersedge Dr
- 8487 Watersedge Dr
- 830 Horseshoe Ln
- 3 Lots Tiburon Dr
- 4187 Elder Ct Unit 5
- 4320 Cobblewood Ct
- 207 Melinda Ln
- 821 Amesbury Dr
- 825 Amesbury Dr
- 833 Amesbury Dr
- 817 Amesbury Dr