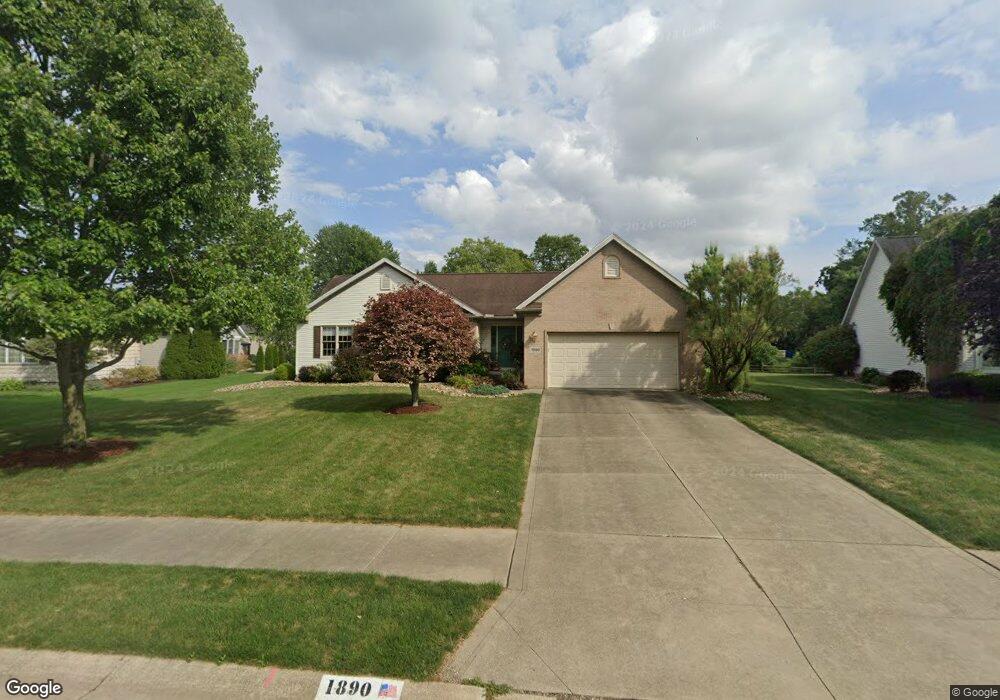
1890 Wendover Cir NE North Canton, OH 44720
Estimated Value: $361,844 - $471,000
3
Beds
2
Baths
2,108
Sq Ft
$194/Sq Ft
Est. Value
About This Home
This home is located at 1890 Wendover Cir NE, North Canton, OH 44720 and is currently estimated at $408,961, approximately $194 per square foot. 1890 Wendover Cir NE is a home located in Stark County with nearby schools including Middlebranch Elementary School, Oakwood Middle School, and GlenOak High School.
Ownership History
Date
Name
Owned For
Owner Type
Purchase Details
Closed on
Jul 1, 2024
Sold by
Conley Benjamin F and Johnson Margaret R
Bought by
Conley Benjamin F and Johnson Margaret R
Current Estimated Value
Purchase Details
Closed on
Apr 14, 2014
Sold by
Piccari Joseph S
Bought by
Conley Benjamin F and Johnston Margaret R
Purchase Details
Closed on
Aug 30, 2010
Sold by
Piccari Kathleen A
Bought by
Piccari Joseph S and The Joseph S Piccari Jr Revocable Trust
Home Financials for this Owner
Home Financials are based on the most recent Mortgage that was taken out on this home.
Original Mortgage
$77,500
Interest Rate
4.6%
Mortgage Type
New Conventional
Purchase Details
Closed on
Sep 26, 2005
Sold by
Piccari Joseph S and Piccari Kathleen A
Bought by
Piccari Kathleen A and Kathleen A Piccari Revocable Trust
Purchase Details
Closed on
Apr 25, 2002
Sold by
Mckinley Development Company
Bought by
Piccari Joseph S and Piccari Kathleen R
Create a Home Valuation Report for This Property
The Home Valuation Report is an in-depth analysis detailing your home's value as well as a comparison with similar homes in the area
Home Values in the Area
Average Home Value in this Area
Purchase History
| Date | Buyer | Sale Price | Title Company |
|---|---|---|---|
| Conley Benjamin F | -- | None Listed On Document | |
| Conley Benjamin F | $252,200 | None Available | |
| Piccari Joseph S | -- | Attorney | |
| Piccari Kathleen A | -- | -- | |
| Piccari Joseph S | $46,000 | -- |
Source: Public Records
Mortgage History
| Date | Status | Borrower | Loan Amount |
|---|---|---|---|
| Previous Owner | Piccari Joseph S | $77,500 |
Source: Public Records
Tax History Compared to Growth
Tax History
| Year | Tax Paid | Tax Assessment Tax Assessment Total Assessment is a certain percentage of the fair market value that is determined by local assessors to be the total taxable value of land and additions on the property. | Land | Improvement |
|---|---|---|---|---|
| 2025 | -- | $114,560 | $29,540 | $85,020 |
| 2024 | -- | $114,560 | $29,540 | $85,020 |
| 2023 | $4,557 | $110,750 | $28,460 | $82,290 |
| 2022 | $4,577 | $110,750 | $28,460 | $82,290 |
| 2021 | $4,230 | $110,750 | $28,460 | $82,290 |
| 2020 | $4,043 | $93,810 | $24,750 | $69,060 |
| 2019 | $4,000 | $93,810 | $24,750 | $69,060 |
| 2018 | $3,937 | $93,810 | $24,750 | $69,060 |
| 2017 | $3,893 | $85,580 | $21,700 | $63,880 |
| 2016 | $3,900 | $85,580 | $21,700 | $63,880 |
| 2015 | $3,910 | $85,580 | $21,700 | $63,880 |
| 2014 | $1,183 | $74,660 | $18,940 | $55,720 |
| 2013 | $1,520 | $71,550 | $18,940 | $52,610 |
Source: Public Records
Map
Nearby Homes
- 119 Stone Crossing St NE
- 1010 Las Olas Blvd NW
- 2211 Markley St NW
- 1141 Las Olas Blvd NW
- 1200 Briarview Ave NW
- 0 Marquardt Dr NW
- 1240 Fountain View St NE
- 1216 Marquardt Ave NW
- 1904 Red Coach Rd NW
- 1404 Southbrook Cir NE
- 0 Marquardt Ave
- 6816 Harrington Court Ave NE
- 6650 Harvest Ridge Ave NE
- Cumberland Plan at Fountains at Edgewood
- Roanoke Plan at Fountains at Edgewood
- Lehigh w/ 3-Car Garage Plan at Fountains at Edgewood
- Powell Plan at Fountains at Edgewood
- 1240 7th St NE
- 1369 Gate House St NE
- 1544 Gate House St NE
- 1884 Wendover Cir NE
- 1900 Wendover Cir NE
- 1920 Kingscote Cir NE
- 1876 Wendover Cir NE
- 1889 Wendover Cir NE
- 1926 Kingscote Cir NE
- 1901 Wendover Cir NE
- 1877 Wendover Cir NE
- 1917 Kingscote Cir NE
- 1909 Kingscote Cir NE
- 1866 Wendover Cir NE
- 1911 Wendover Cir NE
- 1865 Wendover Cir NE
- 1933 Kingscote Cir NE
- 304 Fenchurch Cir NE
- 1919 Wendover Cir NE
- 1856 Wendover Cir NE
- 310 Fenchurch Cir NE
- 1928 Wendover Cir NE
- 1851 Wendover Cir NE