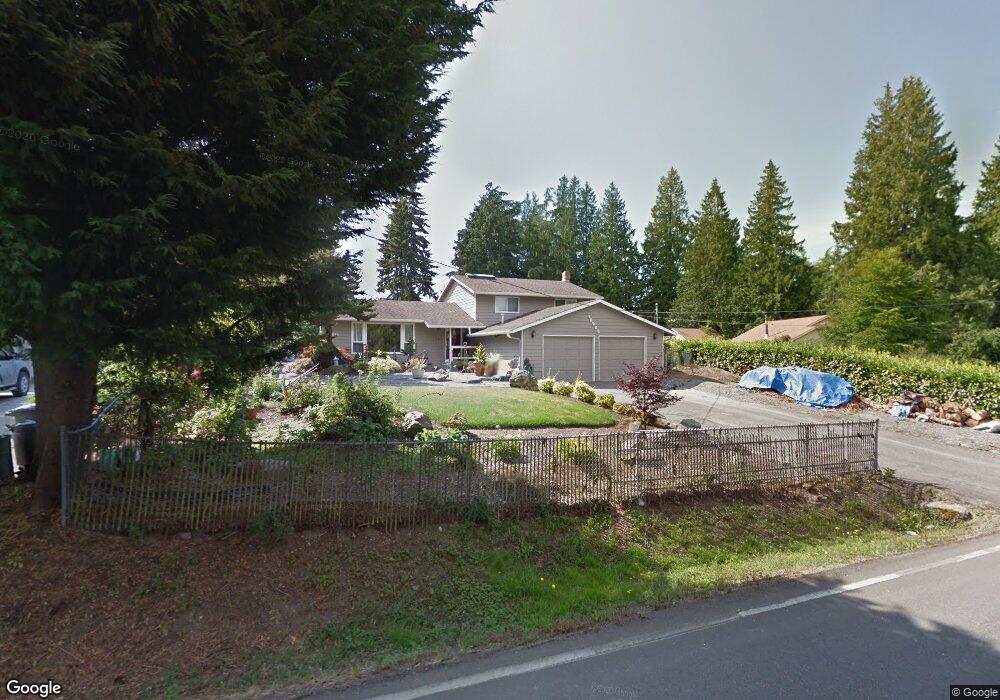
18908 83rd Ave W Edmonds, WA 98026
Perrinville - Seaview NeighborhoodEstimated Value: $885,000 - $1,294,000
4
Beds
2
Baths
2,000
Sq Ft
$534/Sq Ft
Est. Value
About This Home
This home is located at 18908 83rd Ave W, Edmonds, WA 98026 and is currently estimated at $1,067,499, approximately $533 per square foot. 18908 83rd Ave W is a home located in Snohomish County with nearby schools including Seaview Elementary School, Meadowdale Middle School, and Meadowdale High School.
Ownership History
Date
Name
Owned For
Owner Type
Purchase Details
Closed on
Sep 22, 2025
Sold by
Davis Jeffrey Alan
Bought by
Moore Ruth R
Current Estimated Value
Home Financials for this Owner
Home Financials are based on the most recent Mortgage that was taken out on this home.
Original Mortgage
$402,500
Outstanding Balance
$402,500
Interest Rate
6.63%
Mortgage Type
New Conventional
Estimated Equity
$664,999
Purchase Details
Closed on
Aug 9, 2021
Sold by
Moore Matthew A and Estate Of Edwin A Moore
Bought by
Gloria B Moore Irrevocable Trust
Purchase Details
Closed on
Feb 7, 2012
Sold by
Manke Nenette E
Bought by
Moore Edwin Alan
Purchase Details
Closed on
Jun 20, 2008
Sold by
Moore Durwood A and Moore Gloria B
Bought by
Moore Edwin Alan and Manke Nenette E
Create a Home Valuation Report for This Property
The Home Valuation Report is an in-depth analysis detailing your home's value as well as a comparison with similar homes in the area
Home Values in the Area
Average Home Value in this Area
Purchase History
| Date | Buyer | Sale Price | Title Company |
|---|---|---|---|
| Moore Ruth R | $313 | Stewart Title | |
| Moore Zachary R | $575,000 | Stewart Title | |
| Gloria B Moore Irrevocable Trust | -- | None Available | |
| Moore Edwin Alan | -- | None Available | |
| Moore Edwin Alan | -- | None Available |
Source: Public Records
Mortgage History
| Date | Status | Borrower | Loan Amount |
|---|---|---|---|
| Open | Moore Zachary R | $402,500 |
Source: Public Records
Tax History Compared to Growth
Tax History
| Year | Tax Paid | Tax Assessment Tax Assessment Total Assessment is a certain percentage of the fair market value that is determined by local assessors to be the total taxable value of land and additions on the property. | Land | Improvement |
|---|---|---|---|---|
| 2025 | $6,275 | $914,100 | $570,000 | $344,100 |
| 2024 | $6,275 | $889,100 | $545,000 | $344,100 |
| 2023 | $5,915 | $868,400 | $526,000 | $342,400 |
| 2022 | $5,763 | $695,900 | $407,000 | $288,900 |
| 2020 | $5,907 | $635,900 | $385,000 | $250,900 |
| 2019 | $5,461 | $592,500 | $350,000 | $242,500 |
| 2018 | $5,487 | $514,400 | $297,000 | $217,400 |
| 2017 | $4,650 | $456,600 | $253,000 | $203,600 |
| 2016 | $4,298 | $418,400 | $223,000 | $195,400 |
| 2015 | $4,460 | $408,900 | $216,000 | $192,900 |
| 2013 | $3,198 | $276,800 | $151,000 | $125,800 |
Source: Public Records
Map
Nearby Homes
- 8608 185th Place SW
- 18757 76th Ave W
- 19523 86th Ave W Unit 523
- 8019 196th St SW Unit C4
- 8516 196th St SW Unit 105
- 8516 196th St SW Unit 302
- 8516 196th St SW Unit 206
- 8516 196th St SW Unit 311
- 18312 73rd Ave W
- 19718 76th Ave W Unit C
- 8427 200th St SW
- 192 XX Olympic View Dr
- 157 xx 72nd Ave W
- 7525 178th Place SW
- 18628 70th Ave W
- 20126 81st Ave W
- 20111 80th Ave W
- 7606 201st St SW Unit G
- 8036 Cyrus Place
- 7702 202nd Place SW
- 18916 83rd Ave W
- 18822 83rd Ave W
- 18926 83rd Ave W
- 18905 84th Ave W
- 18915 84th Ave W
- 18901 84th Ave W
- 18909 83rd Ave W
- 18921 84th Ave W
- 18915 83rd Ave W
- 18831 83rd Ave W
- 18823 84th Ave W
- 18823 83rd Ave W
- 18925 83rd Ave W
- 19006 83rd Ave W
- 8302 188th St SW
- 8314 188th St SW
- 8214 188th St SW
- 19007 84th Ave W
- 19009 83rd Ave W
- 8320 188th St SW