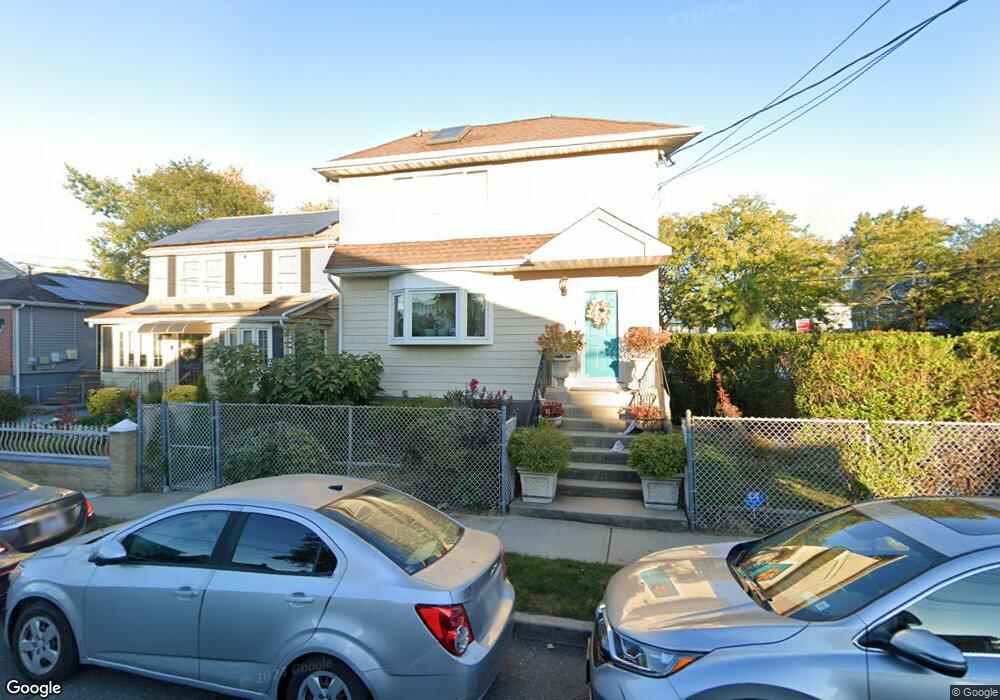
18919 Pineville Ln Springfield Gardens, NY 11413
Saint Albans NeighborhoodEstimated Value: $561,000 - $767,527
3
Beds
4
Baths
1,076
Sq Ft
$616/Sq Ft
Est. Value
About This Home
This home is located at 18919 Pineville Ln, Springfield Gardens, NY 11413 and is currently estimated at $663,132, approximately $616 per square foot. 18919 Pineville Ln is a home located in Queens County with nearby schools including P.S. 15 Jackie Robinson, Is 59 Springfield Gardens, and Success Academy Springfield Gardens.
Ownership History
Date
Name
Owned For
Owner Type
Purchase Details
Closed on
Sep 1, 2017
Sold by
P O P Realty Corp
Bought by
Castle Krystal
Current Estimated Value
Home Financials for this Owner
Home Financials are based on the most recent Mortgage that was taken out on this home.
Original Mortgage
$439,786
Outstanding Balance
$365,388
Interest Rate
3.89%
Mortgage Type
New Conventional
Estimated Equity
$297,744
Purchase Details
Closed on
Feb 8, 2017
Sold by
Bastien Justina
Bought by
P O P Realty Corp
Purchase Details
Closed on
May 11, 2005
Sold by
Ronjus Holding Corp
Bought by
Bastien Justina
Home Financials for this Owner
Home Financials are based on the most recent Mortgage that was taken out on this home.
Original Mortgage
$78,900
Interest Rate
5.94%
Purchase Details
Closed on
May 1, 2001
Sold by
Sommo Ronald G and Potaris Gus
Bought by
Ronjus Holding Corp
Purchase Details
Closed on
Dec 11, 2000
Sold by
The City Of New York
Bought by
Sommo Ronald G and Potaris Gus
Create a Home Valuation Report for This Property
The Home Valuation Report is an in-depth analysis detailing your home's value as well as a comparison with similar homes in the area
Home Values in the Area
Average Home Value in this Area
Purchase History
| Date | Buyer | Sale Price | Title Company |
|---|---|---|---|
| Castle Krystal | $450,000 | -- | |
| P O P Realty Corp | $305,000 | -- | |
| Bastien Justina | $400,023 | -- | |
| Bastien Justina | $400,023 | -- | |
| Ronjus Holding Corp | -- | -- | |
| Ronjus Holding Corp | -- | -- | |
| Sommo Ronald G | $10,000 | -- | |
| Sommo Ronald G | $10,000 | -- |
Source: Public Records
Mortgage History
| Date | Status | Borrower | Loan Amount |
|---|---|---|---|
| Open | Castle Krystal | $439,786 | |
| Previous Owner | Bastien Justina | $78,900 | |
| Previous Owner | Bastien Justina | $315,600 |
Source: Public Records
Tax History Compared to Growth
Tax History
| Year | Tax Paid | Tax Assessment Tax Assessment Total Assessment is a certain percentage of the fair market value that is determined by local assessors to be the total taxable value of land and additions on the property. | Land | Improvement |
|---|---|---|---|---|
| 2025 | $3,994 | $19,886 | $5,062 | $14,824 |
| 2024 | $3,994 | $19,886 | $5,268 | $14,618 |
| 2023 | $3,964 | $19,735 | $5,747 | $13,988 |
| 2022 | $3,717 | $31,260 | $10,920 | $20,340 |
| 2021 | $3,697 | $32,940 | $10,920 | $22,020 |
| 2020 | $3,508 | $33,060 | $10,920 | $22,140 |
| 2019 | $3,467 | $33,240 | $10,920 | $22,320 |
| 2018 | $3,353 | $16,446 | $5,413 | $11,033 |
| 2017 | $2,863 | $15,516 | $6,099 | $9,417 |
| 2016 | $2,616 | $15,516 | $6,099 | $9,417 |
| 2015 | $1,546 | $13,810 | $7,970 | $5,840 |
| 2014 | $1,546 | $13,810 | $9,057 | $4,753 |
Source: Public Records
Map
Nearby Homes
- 19115 Williamson Ave
- 12512 Nepton St
- 192-17 Williamson Ave
- 18806 Nashville Blvd
- 12248 Benton St
- 187-16 Williamson Ave
- 19332 Williamson Ave
- 187-01 Ridgedale St
- 12251 Grayson St
- 194-01 Nashville Blvd
- 19401 Nashville Blvd
- 187-04 Williamson Ave
- 191-01 122nd Ave
- 13024 Springfield Blvd
- 19009 122nd Ave
- 13049 217th St
- 12253 Milburn St
- 194-09 122nd Ave
- 130-25 217th St
- 21608 Merrick Blvd
- 18919 Pineville Ln
- 18915 Pineville Ln
- 35-11 Lucas St
- 18907 Pineville Ln
- 18916 Pineville Ln
- 189-04 Pineville Ln Unit 2nd Fl
- 12417 Lucas St
- 18903 Pineville Ln
- 12421 Lucas St
- 19006 Williamson Ave
- 12506 Lucas St
- 189-04 Nepton St
- 18918 Williamson Ave
- 18904 Pineville Ln
- 19012 Williamson Ave
- 12425 Lucas St
- 12509 Nepton St
- 18916 Williamson Ave
- 124-25 Lucas St
- 12510 Lucas St