Estimated Value: $931,000 - $1,133,000
6
Beds
5
Baths
4,632
Sq Ft
$218/Sq Ft
Est. Value
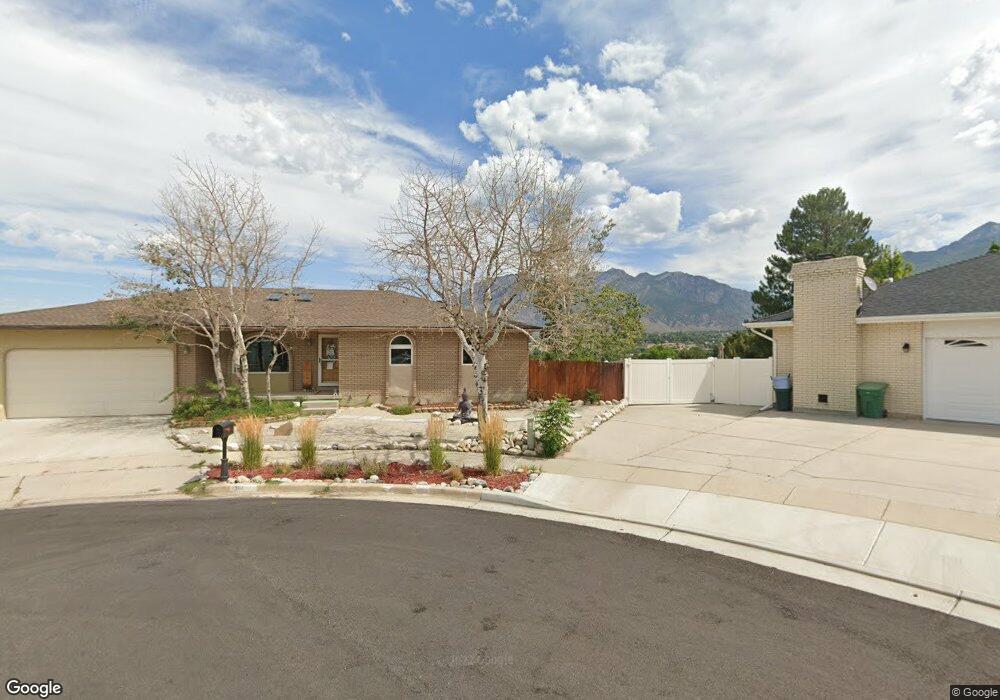
About This Home
This home is located at 1892 E Brady Creek Dr, Sandy, UT 84093 and is currently estimated at $1,010,631, approximately $218 per square foot. 1892 E Brady Creek Dr is a home located in Salt Lake County with nearby schools including Oakdale School, Albion Middle School, and Hillcrest High School.
Ownership History
Date
Name
Owned For
Owner Type
Purchase Details
Closed on
Nov 30, 2021
Sold by
Merrill Andrew and Merrill Joni
Bought by
Ajm Family Trust and Merrill
Current Estimated Value
Purchase Details
Closed on
Nov 12, 2020
Sold by
Ojala Janne and Ojala Tujia
Bought by
Merrill Andrew and Merrill Joni
Home Financials for this Owner
Home Financials are based on the most recent Mortgage that was taken out on this home.
Original Mortgage
$510,400
Interest Rate
2.8%
Mortgage Type
New Conventional
Purchase Details
Closed on
May 24, 2012
Sold by
Nyborg Lance A and Nyborg Holly M
Bought by
Ojala Janne and Ojala Tuija
Home Financials for this Owner
Home Financials are based on the most recent Mortgage that was taken out on this home.
Original Mortgage
$360,000
Interest Rate
3.85%
Mortgage Type
New Conventional
Purchase Details
Closed on
Feb 28, 2006
Sold by
Nyborg Holly M
Bought by
Nyborg Lance A and Nyborg Holly M
Home Financials for this Owner
Home Financials are based on the most recent Mortgage that was taken out on this home.
Original Mortgage
$332,000
Interest Rate
6%
Mortgage Type
Purchase Money Mortgage
Purchase Details
Closed on
Sep 13, 2004
Sold by
Hardy Chelsie
Bought by
Nyborg Lance A and Nyborg Holly M
Home Financials for this Owner
Home Financials are based on the most recent Mortgage that was taken out on this home.
Original Mortgage
$260,000
Interest Rate
5.25%
Mortgage Type
Purchase Money Mortgage
Purchase Details
Closed on
Sep 26, 2003
Sold by
Hardy Paul J
Bought by
Hardy Chelsie
Purchase Details
Closed on
Jul 21, 2000
Sold by
Hardy Paul J
Bought by
Taylor Deanne and Taylor Richard Harlan
Home Financials for this Owner
Home Financials are based on the most recent Mortgage that was taken out on this home.
Original Mortgage
$374,161
Interest Rate
8.55%
Mortgage Type
Seller Take Back
Purchase Details
Closed on
Jul 7, 2000
Sold by
Taylor Deanne and Taylor Md Richard Harlan
Bought by
Hardy Paul J
Home Financials for this Owner
Home Financials are based on the most recent Mortgage that was taken out on this home.
Original Mortgage
$374,161
Interest Rate
8.55%
Mortgage Type
Seller Take Back
Purchase Details
Closed on
Jan 13, 1997
Sold by
Taylor Deanne and Taylor Richard Harlan
Bought by
Taylor Deanne and Taylor Richard Harlan
Home Financials for this Owner
Home Financials are based on the most recent Mortgage that was taken out on this home.
Original Mortgage
$166,000
Interest Rate
7.46%
Create a Home Valuation Report for This Property
The Home Valuation Report is an in-depth analysis detailing your home's value as well as a comparison with similar homes in the area
Home Values in the Area
Average Home Value in this Area
Purchase History
| Date | Buyer | Sale Price | Title Company |
|---|---|---|---|
| Ajm Family Trust | -- | Accommodation/Courtesy Recordi | |
| Merrill Andrew | -- | Old Republic Ttl Draper Orem | |
| Ojala Janne | -- | None Available | |
| Nyborg Lance A | -- | Meridian Title | |
| Nyborg Holly M | -- | Meridian Title | |
| Nyborg Lance A | -- | Superior Title | |
| Hardy Chelsie | -- | Horizon Title | |
| Taylor Deanne | -- | Associated Title | |
| Hardy Paul J | -- | Associated Title | |
| Hardy Paul J | -- | Associated Title | |
| Taylor Deanne | -- | -- | |
| Taylor Deanne | -- | -- |
Source: Public Records
Mortgage History
| Date | Status | Borrower | Loan Amount |
|---|---|---|---|
| Previous Owner | Merrill Andrew | $510,400 | |
| Previous Owner | Ojala Janne | $360,000 | |
| Previous Owner | Nyborg Holly M | $332,000 | |
| Previous Owner | Nyborg Lance A | $60,000 | |
| Previous Owner | Nyborg Lance A | $260,000 | |
| Previous Owner | Hardy Paul J | $374,161 | |
| Previous Owner | Hardy Paul J | $374,883 | |
| Previous Owner | Taylor Deanne | $166,000 | |
| Closed | Nyborg Lance A | $65,000 |
Source: Public Records
Tax History
| Year | Tax Paid | Tax Assessment Tax Assessment Total Assessment is a certain percentage of the fair market value that is determined by local assessors to be the total taxable value of land and additions on the property. | Land | Improvement |
|---|---|---|---|---|
| 2025 | $4,593 | $961,600 | $303,000 | $658,600 |
| 2024 | $4,593 | $860,900 | $291,700 | $569,200 |
| 2023 | $4,362 | $816,200 | $280,500 | $535,700 |
| 2022 | $4,478 | $824,200 | $275,000 | $549,200 |
| 2021 | $3,996 | $626,200 | $214,100 | $412,100 |
| 2020 | $4,120 | $609,200 | $214,100 | $395,100 |
| 2019 | $3,739 | $539,500 | $202,000 | $337,500 |
| 2018 | $3,457 | $521,600 | $202,000 | $319,600 |
| 2017 | $3,301 | $476,500 | $202,000 | $274,500 |
| 2016 | $3,090 | $431,200 | $182,000 | $249,200 |
| 2015 | $3,908 | $505,600 | $216,400 | $289,200 |
| 2014 | $3,776 | $479,800 | $210,500 | $269,300 |
Source: Public Records
Map
Nearby Homes
- 1990 E Terra Vista Way
- 1924 E Viscounti Cove
- 8483 Terrace Dr
- 8642 S Cessna Cir
- 8638 Piper Ln
- 1627 E Mulberry Way
- 8492 S Mesa Dr
- 8081 Beaumont Dr
- 2152 E Creek Rd
- 8411 S 1475 E
- 1891 Richard Rd
- 1579 E 8730 S
- 8266 S Creek Hollow Cove
- 2161 E Lorita Way
- 1430 E 8685 S
- 1371 Sudbury Ave
- 8797 S Capella Way
- 8352 S 1330 E
- 2238 Cottonwood Cove Ln
- 8857 S Capella Way
- 1892 Brady Creek Dr
- 1904 E Brady Creek Dr
- 1904 Brady Creek Dr
- 1880 E Brady Creek Dr
- 1880 Brady Creek Dr
- 1891 Rua Branco Dr
- 1891 E Rua Branco Dr
- 1883 Rua Branco Dr
- 1883 E Rua Branco Dr
- 1899 Rua Branco Dr
- 8395 Azul Way
- 1916 Brady Creek Dr
- 1881 E Brady Creek Dr
- 1881 Brady Creek Dr
- 1895 Brady Creek Dr
- 1905 Brady Creek Dr
- 1905 E Brady Creek Dr
- 8411 Azul Way
- 1909 E Rua Branco Dr
- 1909 Rua Branco Dr
Your Personal Tour Guide
Ask me questions while you tour the home.