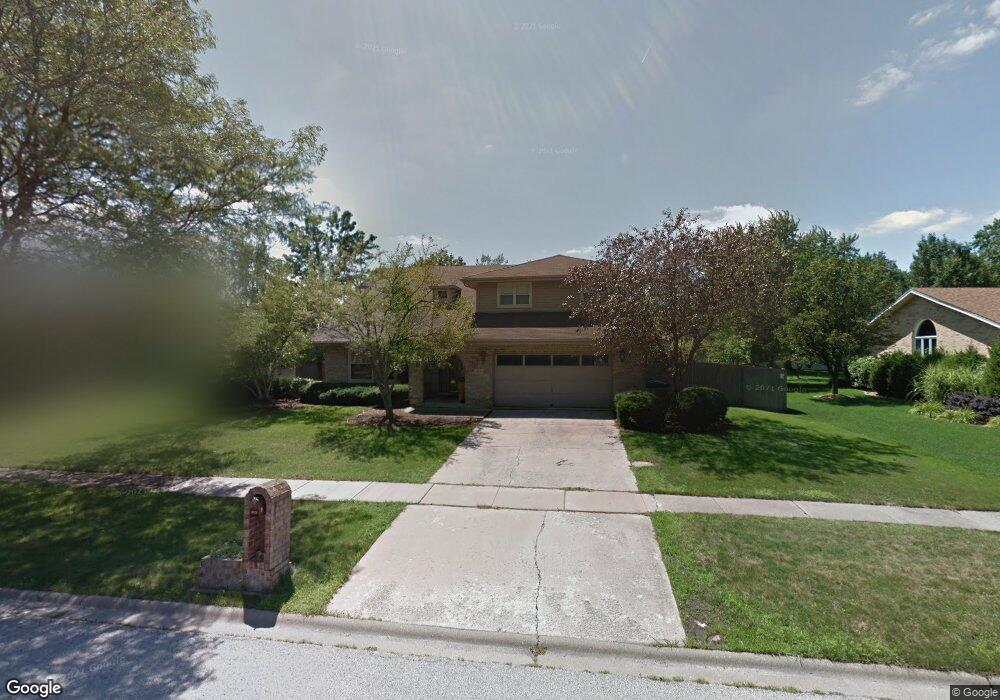
18920 Creekview Ln Mokena, IL 60448
Estimated Value: $531,000 - $575,000
5
Beds
5
Baths
3,402
Sq Ft
$162/Sq Ft
Est. Value
About This Home
This home is located at 18920 Creekview Ln, Mokena, IL 60448 and is currently estimated at $549,660, approximately $161 per square foot. 18920 Creekview Ln is a home located in Will County with nearby schools including Mokena Elementary School, Mokena Intermediate School, and Mokena Jr High School.
Ownership History
Date
Name
Owned For
Owner Type
Purchase Details
Closed on
Sep 6, 2007
Sold by
Standard Bank & Trust Co
Bought by
Richer Harry W and Richer Holly K
Current Estimated Value
Purchase Details
Closed on
Jun 17, 2005
Sold by
Mcgovern Brian E and Mc Govern Dawn M
Bought by
Richer Harry W and Richer Holly K
Home Financials for this Owner
Home Financials are based on the most recent Mortgage that was taken out on this home.
Original Mortgage
$252,000
Interest Rate
5.74%
Mortgage Type
Fannie Mae Freddie Mac
Purchase Details
Closed on
Aug 23, 2001
Sold by
Zolan Phillip C and Zolan Debra A
Bought by
Mcgovern Brian E and Mcgovern Dawn M
Home Financials for this Owner
Home Financials are based on the most recent Mortgage that was taken out on this home.
Original Mortgage
$235,600
Interest Rate
6.92%
Create a Home Valuation Report for This Property
The Home Valuation Report is an in-depth analysis detailing your home's value as well as a comparison with similar homes in the area
Home Values in the Area
Average Home Value in this Area
Purchase History
| Date | Buyer | Sale Price | Title Company |
|---|---|---|---|
| Richer Harry W | -- | None Available | |
| Richer Harry W | $352,000 | First American Title Ins Co | |
| Mcgovern Brian E | $294,500 | Stewart Title Company |
Source: Public Records
Mortgage History
| Date | Status | Borrower | Loan Amount |
|---|---|---|---|
| Previous Owner | Richer Harry W | $252,000 | |
| Previous Owner | Mcgovern Brian E | $235,600 | |
| Closed | Mcgovern Brian E | $29,154 |
Source: Public Records
Tax History
| Year | Tax Paid | Tax Assessment Tax Assessment Total Assessment is a certain percentage of the fair market value that is determined by local assessors to be the total taxable value of land and additions on the property. | Land | Improvement |
|---|---|---|---|---|
| 2024 | $11,518 | $159,831 | $24,215 | $135,616 |
| 2023 | $11,518 | $142,744 | $21,626 | $121,118 |
| 2022 | $10,079 | $130,016 | $19,698 | $110,318 |
| 2021 | $9,495 | $121,635 | $18,428 | $103,207 |
| 2020 | $9,301 | $118,207 | $17,909 | $100,298 |
| 2019 | $9,016 | $115,044 | $17,430 | $97,614 |
| 2018 | $8,719 | $111,737 | $16,929 | $94,808 |
| 2017 | $8,562 | $109,129 | $16,534 | $92,595 |
| 2016 | $8,326 | $105,388 | $15,967 | $89,421 |
| 2015 | $7,929 | $101,677 | $15,405 | $86,272 |
| 2014 | $7,929 | $100,970 | $15,298 | $85,672 |
| 2013 | $7,929 | $102,279 | $15,496 | $86,783 |
Source: Public Records
Map
Nearby Homes
- W Maple Rd
- 11617 Parkside Ln
- 12050 Josephine Dr
- 18728 S Mill Creek Dr
- 11254 192nd St
- 12002 Ashbrook Ln
- 19502 116th Ave Unit C
- 19511 116th Ave Unit D
- 12165 W Castle Dr
- 19380 Wolf Rd Unit 6
- 19545 116th Ave Unit A
- 19539 116th Ave Unit B
- 12351 W Warren Dr
- 11040 Bryant Rd
- 11608 197th St
- 18714 Wren Cir
- 18144 Lake Shore Dr
- 11321 1st St
- 11325 1st St
- 11317 1st St
- 18916 Creekview Ln
- 18924 Creekview Ln Unit 1
- 18917 Creekview Ln
- 18912 Creekview Ln Unit 1
- 18912 Creekview Ln
- 18921 Creekview Ln
- 18928 Creekview Ln
- 18913 Creekview Ln
- 18925 Creekview Ln
- 18943 Leila Dr
- 18931 Leila Dr
- 18932 Creekview Ln
- 18908 Creekview Ln
- 18929 Creekview Ln Unit 1
- 18909 Creekview Ln
- 18920 Meadow Creek Dr Unit 2
- 18916 Meadow Creek Dr
- 18959 Leila Dr
- 18912 Meadow Creek Dr
- 18924 Meadow Creek Dr
Your Personal Tour Guide
Ask me questions while you tour the home.