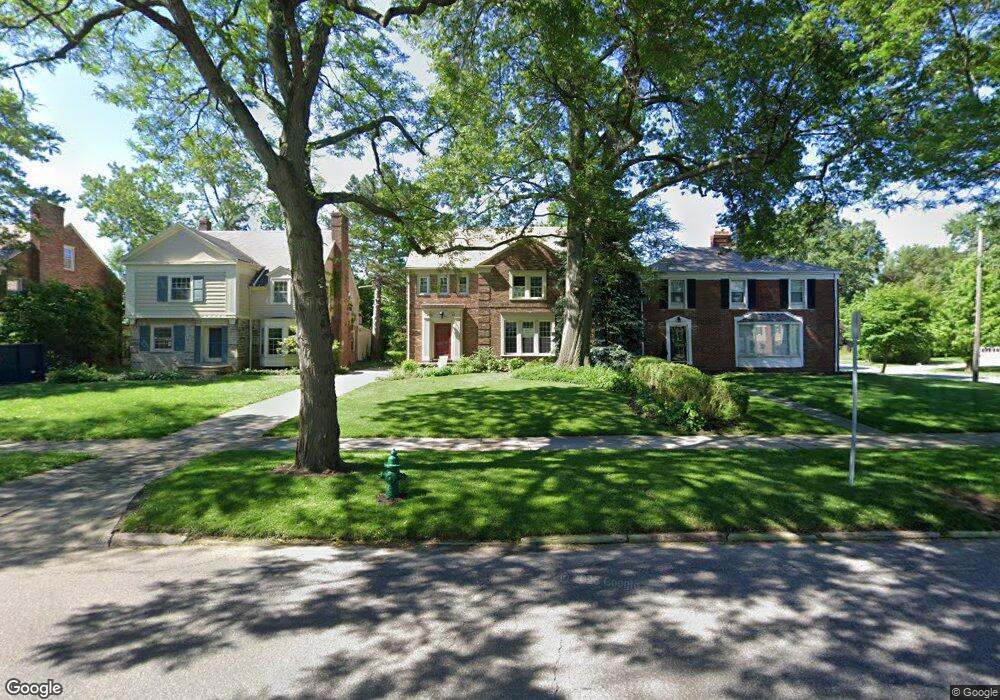
18923 Lomond Blvd Shaker Heights, OH 44122
Estimated Value: $264,000 - $355,000
4
Beds
4
Baths
1,960
Sq Ft
$167/Sq Ft
Est. Value
About This Home
This home is located at 18923 Lomond Blvd, Shaker Heights, OH 44122 and is currently estimated at $327,273, approximately $166 per square foot. 18923 Lomond Blvd is a home located in Cuyahoga County with nearby schools including Lomond Elementary School, Woodbury Elementary School, and Shaker Heights Middle School.
Ownership History
Date
Name
Owned For
Owner Type
Purchase Details
Closed on
May 16, 2011
Sold by
Setser Randolph
Bought by
Noecker Angela
Current Estimated Value
Purchase Details
Closed on
Dec 14, 2000
Sold by
Mayhall Ruth E
Bought by
Setser Randolph M and Noecker Angela M
Home Financials for this Owner
Home Financials are based on the most recent Mortgage that was taken out on this home.
Original Mortgage
$158,175
Interest Rate
7.8%
Purchase Details
Closed on
Nov 28, 1983
Sold by
Elliott Donald O
Bought by
Mayhall Ruth E
Purchase Details
Closed on
Oct 30, 1980
Sold by
Baker Maurine D
Bought by
Elliott Donald O
Purchase Details
Closed on
Sep 8, 1978
Sold by
Baker Chas B and M D
Bought by
Baker Maurine D
Purchase Details
Closed on
Jan 1, 1975
Bought by
Baker Chas B and M D
Create a Home Valuation Report for This Property
The Home Valuation Report is an in-depth analysis detailing your home's value as well as a comparison with similar homes in the area
Home Values in the Area
Average Home Value in this Area
Purchase History
| Date | Buyer | Sale Price | Title Company |
|---|---|---|---|
| Noecker Angela | -- | Attorney | |
| Setser Randolph M | $166,500 | -- | |
| Mayhall Ruth E | $87,000 | -- | |
| Elliott Donald O | $77,000 | -- | |
| Baker Maurine D | -- | -- | |
| Baker Chas B | -- | -- |
Source: Public Records
Mortgage History
| Date | Status | Borrower | Loan Amount |
|---|---|---|---|
| Previous Owner | Setser Randolph M | $158,175 |
Source: Public Records
Tax History Compared to Growth
Tax History
| Year | Tax Paid | Tax Assessment Tax Assessment Total Assessment is a certain percentage of the fair market value that is determined by local assessors to be the total taxable value of land and additions on the property. | Land | Improvement |
|---|---|---|---|---|
| 2024 | $9,057 | $101,430 | $15,820 | $85,610 |
| 2023 | $8,303 | $73,680 | $12,740 | $60,940 |
| 2022 | $8,069 | $73,675 | $12,740 | $60,935 |
| 2021 | $8,041 | $73,680 | $12,740 | $60,940 |
| 2020 | $7,775 | $66,990 | $11,590 | $55,410 |
| 2019 | $7,663 | $191,400 | $33,100 | $158,300 |
| 2018 | $7,482 | $66,990 | $11,590 | $55,410 |
| 2017 | $7,714 | $62,580 | $11,690 | $50,890 |
| 2016 | $7,267 | $62,580 | $11,690 | $50,890 |
| 2015 | $6,856 | $62,580 | $11,690 | $50,890 |
| 2014 | $6,856 | $56,880 | $10,640 | $46,240 |
Source: Public Records
Map
Nearby Homes
- 19024 Lomond Blvd
- 3609 Stoer Rd
- 18515 Lomond Blvd
- 18985 Chagrin Blvd
- 3635 Tolland Rd
- 18431 Newell Rd
- 3575 Gridley Rd
- 3683 Stoer Rd
- 18413 Newell Rd
- 3656 Latimore Rd
- 3696 Tolland Rd
- 3665 Sutherland Rd
- 19635 Chagrin Blvd
- 3676 Rawnsdale Rd
- 18416 Winslow Rd
- 18520 Van Aken Blvd
- 3651 Rawnsdale Rd
- 3638 Glencairn Rd
- 18975 Van Aken Blvd Unit 407
- 18975 Van Aken Blvd Unit 401
- 18917 Lomond Blvd
- 18929 Lomond Blvd
- 3570 Townley Rd
- 18911 Lomond Blvd
- 3566 Townley Rd
- 3569 Lynnfield Rd
- 18907 Lomond Blvd
- 19001 Lomond Blvd
- 3562 Townley Rd
- 3565 Lynnfield Rd
- 3561 Lynnfield Rd
- 3558 Townley Rd
- 19007 Lomond Blvd
- 18924 Lomond Blvd
- 18930 Lomond Blvd
- 18918 Lomond Blvd
- 3557 Lynnfield Rd
- 3565 Townley Rd
- 18912 Lomond Blvd
- 3554 Townley Rd