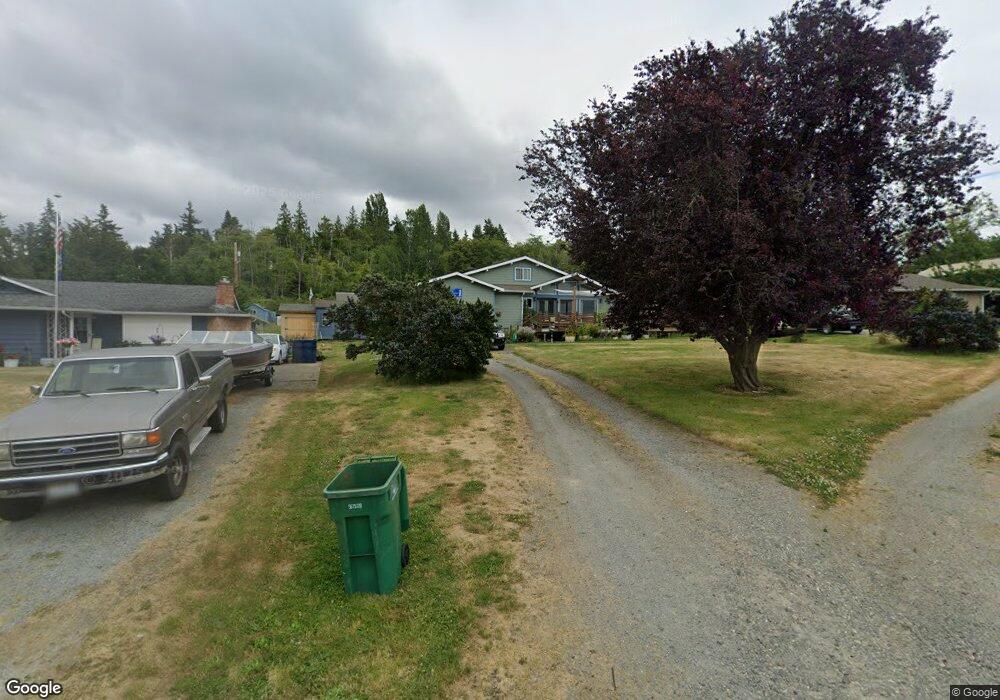
18927 Soundview Dr NW Stanwood, WA 98292
Warm Beach NeighborhoodEstimated Value: $519,000 - $617,000
2
Beds
1
Bath
907
Sq Ft
$607/Sq Ft
Est. Value
About This Home
This home is located at 18927 Soundview Dr NW, Stanwood, WA 98292 and is currently estimated at $550,139, approximately $606 per square foot. 18927 Soundview Dr NW is a home located in Snohomish County with nearby schools including Stanwood Elementary School, Port Susan Middle School, and Stanwood High School.
Ownership History
Date
Name
Owned For
Owner Type
Purchase Details
Closed on
May 17, 2001
Sold by
Mcdowell Paul T
Bought by
Mcdowell Paul T and Mcdowell Adrianna
Current Estimated Value
Home Financials for this Owner
Home Financials are based on the most recent Mortgage that was taken out on this home.
Original Mortgage
$138,750
Outstanding Balance
$51,924
Interest Rate
7.06%
Estimated Equity
$498,215
Purchase Details
Closed on
Mar 30, 1998
Sold by
Herkey Sandra M Geer
Bought by
Mcdowell Paul
Home Financials for this Owner
Home Financials are based on the most recent Mortgage that was taken out on this home.
Original Mortgage
$103,300
Interest Rate
10.05%
Purchase Details
Closed on
Feb 13, 1996
Sold by
Berkey Douglas C and Geer Don M
Bought by
Berkey Sandra M
Create a Home Valuation Report for This Property
The Home Valuation Report is an in-depth analysis detailing your home's value as well as a comparison with similar homes in the area
Home Values in the Area
Average Home Value in this Area
Purchase History
| Date | Buyer | Sale Price | Title Company |
|---|---|---|---|
| Mcdowell Paul T | -- | Pacific Northwest Title | |
| Mcdowell Paul | $116,000 | Evergreen Title Company Inc | |
| Berkey Sandra M | -- | Chicago Title Insurance Co |
Source: Public Records
Mortgage History
| Date | Status | Borrower | Loan Amount |
|---|---|---|---|
| Open | Mcdowell Paul T | $138,750 | |
| Closed | Mcdowell Paul | $103,300 |
Source: Public Records
Tax History Compared to Growth
Tax History
| Year | Tax Paid | Tax Assessment Tax Assessment Total Assessment is a certain percentage of the fair market value that is determined by local assessors to be the total taxable value of land and additions on the property. | Land | Improvement |
|---|---|---|---|---|
| 2025 | $3,324 | $447,800 | $252,700 | $195,100 |
| 2024 | $3,324 | $397,900 | $211,700 | $186,200 |
| 2023 | $3,423 | $433,700 | $233,500 | $200,200 |
| 2022 | $3,451 | $354,100 | $192,100 | $162,000 |
| 2020 | $3,076 | $289,600 | $148,400 | $141,200 |
| 2019 | $2,775 | $270,300 | $136,900 | $133,400 |
| 2018 | $2,622 | $235,700 | $110,400 | $125,300 |
| 2017 | $2,512 | $236,900 | $98,900 | $138,000 |
| 2016 | $2,418 | $220,200 | $87,000 | $133,200 |
| 2015 | $2,334 | $203,600 | $82,000 | $121,600 |
| 2013 | $2,179 | $178,300 | $77,000 | $101,300 |
Source: Public Records
Map
Nearby Homes
- 18815 Clarence Ave
- 0 NHNB Clarence Ave
- 0 NHNA Clarence Ave
- 19422 Soundview Dr NW
- 18612 98th Ave NW
- 18826 94th Dr NW
- 8817 Lakewood Rd
- 19904 Soundview Dr NW
- 9003 196th Place NW
- 8203 Lakewood Rd
- 17930 82nd Dr NW
- 16906 Marine Dr
- 16818 Marine Dr
- 7519 184th St NW
- 20909 Frank Waters Rd
- 690 X Olive Ave
- 21426 81st Ave NW
- The Sylvia Plan at Warm Beach Heights
- 6901 Olive Ave
- 6828 Olive Ave
- 19001 Soundview Dr NW
- 18921 Soundview Dr NW
- 18930 98th Ave NW
- 18916 98th Ave NW
- 18906 98th Ave NW
- 18930 Soundview Dr NW
- 19012 Soundview Dr NW
- 19014 Soundview Dr NW
- 19008 Soundview Dr NW
- 19025 Soundview Dr NW
- 18925 98th Ave NW
- 18922 Soundview Dr NW
- 19024 Soundview Dr NW
- 18907 Soundview Dr NW
- 18920 Soundview Dr NW
- 18918 Soundview Dr NW
- 18923 98th Ave NW
- 18921 98th Ave NW
- 18827 Soundview Dr NW
- 19021 98th Ave NW