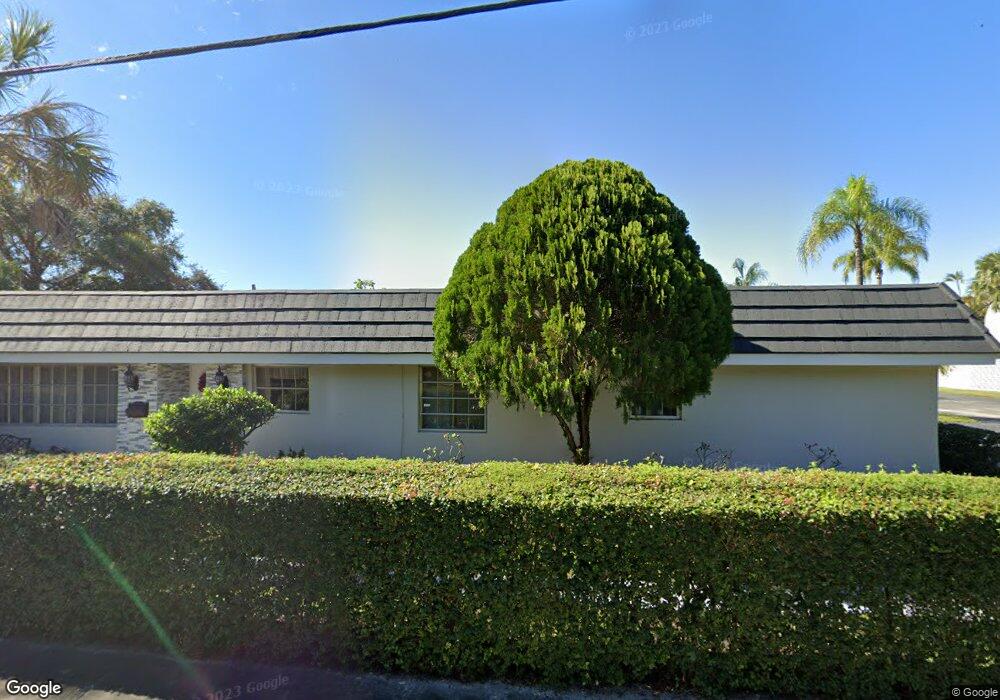
18932 Bobolink Dr Hialeah, FL 33015
Estimated Value: $416,000 - $505,000
3
Beds
2
Baths
1,465
Sq Ft
$316/Sq Ft
Est. Value
About This Home
This home is located at 18932 Bobolink Dr, Hialeah, FL 33015 and is currently estimated at $462,708, approximately $315 per square foot. 18932 Bobolink Dr is a home located in Miami-Dade County with nearby schools including Spanish Lake Elementary School, Country Club Middle School, and American Senior High School.
Ownership History
Date
Name
Owned For
Owner Type
Purchase Details
Closed on
Jul 8, 2022
Sold by
Elaine Roach
Bought by
Roach Jannette and Roach Aldyth
Current Estimated Value
Home Financials for this Owner
Home Financials are based on the most recent Mortgage that was taken out on this home.
Original Mortgage
$227,635
Outstanding Balance
$216,829
Interest Rate
5.23%
Mortgage Type
New Conventional
Estimated Equity
$245,879
Purchase Details
Closed on
Jan 27, 2006
Sold by
Roach Aldyth
Bought by
Roach Elaine and Roach Aldyth
Home Financials for this Owner
Home Financials are based on the most recent Mortgage that was taken out on this home.
Original Mortgage
$175,000
Interest Rate
6.14%
Mortgage Type
New Conventional
Purchase Details
Closed on
Mar 1, 1994
Sold by
Assoc Relocation Mgmt Co Inc
Bought by
Roach Harden Aldyth
Purchase Details
Closed on
Feb 28, 1994
Sold by
Coppage David and Coppage Melissa Mowery
Bought by
Assoc Relocation Mgmt Co Inc
Create a Home Valuation Report for This Property
The Home Valuation Report is an in-depth analysis detailing your home's value as well as a comparison with similar homes in the area
Home Values in the Area
Average Home Value in this Area
Purchase History
| Date | Buyer | Sale Price | Title Company |
|---|---|---|---|
| Roach Jannette | -- | Amrock | |
| Roach Jannette | -- | Amrock | |
| Roach Elaine | -- | Olympia Title & Escrow Corp | |
| Roach Harden Aldyth | $80,000 | -- | |
| Assoc Relocation Mgmt Co Inc | $80,000 | -- |
Source: Public Records
Mortgage History
| Date | Status | Borrower | Loan Amount |
|---|---|---|---|
| Open | Roach Jannette | $227,635 | |
| Closed | Roach Jannette | $227,635 | |
| Previous Owner | Roach Elaine | $175,000 |
Source: Public Records
Tax History
| Year | Tax Paid | Tax Assessment Tax Assessment Total Assessment is a certain percentage of the fair market value that is determined by local assessors to be the total taxable value of land and additions on the property. | Land | Improvement |
|---|---|---|---|---|
| 2025 | $1,972 | $118,864 | -- | -- |
| 2024 | $1,774 | $115,515 | -- | -- |
| 2023 | $1,774 | $112,151 | $0 | $0 |
| 2022 | $1,677 | $108,885 | $0 | $0 |
| 2021 | $1,640 | $105,714 | $0 | $0 |
| 2020 | $1,620 | $104,255 | $0 | $0 |
| 2019 | $1,582 | $101,912 | $0 | $0 |
| 2018 | $1,496 | $100,012 | $0 | $0 |
| 2017 | $1,479 | $97,955 | $0 | $0 |
| 2016 | $1,444 | $95,941 | $0 | $0 |
| 2015 | $1,456 | $95,275 | $0 | $0 |
| 2014 | -- | $94,519 | $0 | $0 |
Source: Public Records
Map
Nearby Homes
- 6723 NW 188th Terrace
- 6782 Brookline Dr Unit 6782
- 19035 E Saint Andrews Dr
- 6821 Brookline Dr Unit 6821
- 6722 NW 192nd Ln
- 6700 NW 190th St
- 6708 NW 193rd Terrace
- 19804 NW 67th Ct
- 19903 NW 67th Ct
- 19907 NW 67th Ct
- 6771 NW 199th Terrace
- 6353 NW 190th Terrace
- 18348 NW 68th Ave Unit D
- 6830 Winged Foot Dr
- 6955 NW 186th St Unit F104
- 18324 NW 68th Ave Unit H
- 18328 NW 68th Ave Unit H
- 18328 NW 68th Ave Unit P
- 18304 NW 68th Ave Unit C
- 6950 Miami Gardens Dr Unit 2-411
- 18940 Bobolink Dr Unit 18940
- 18940 Bobolink Dr
- 18916 Bobolink Dr
- 18908 Bobolink Dr
- 18950 Bobolink Dr
- 18900 Bobolink Dr
- 18958 Bobolink Dr
- 18964 Bobolink Dr
- 18970 Bobolink Dr
- 18978 Bobolink Dr
- 19000 Bobolink Dr
- 19006 Bobolink Dr
- 18940 NW 67th Place
- 18950 NW 67th Place
- 18952 NW 67th Place
- 18954 NW 67th Place
- 18954 NW 67 Place
- 18956 NW 67th Place
- 19012 Bobolink Dr
- 18930 NW 67th Place
Your Personal Tour Guide
Ask me questions while you tour the home.