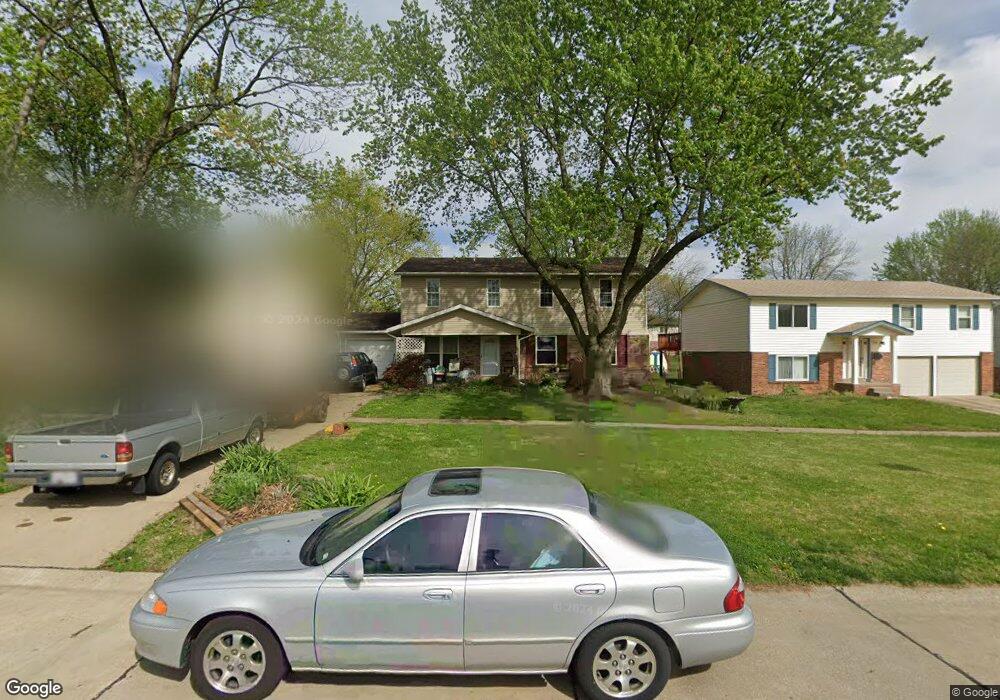
1894 Night Dr Florissant, MO 63031
Estimated Value: $235,005 - $300,000
5
Beds
3
Baths
2,378
Sq Ft
$111/Sq Ft
Est. Value
About This Home
This home is located at 1894 Night Dr, Florissant, MO 63031 and is currently estimated at $263,501, approximately $110 per square foot. 1894 Night Dr is a home located in St. Louis County with nearby schools including Lusher Elementary School, Northwest Middle School, and Hazelwood West High School.
Ownership History
Date
Name
Owned For
Owner Type
Purchase Details
Closed on
Aug 15, 2003
Sold by
Butler Robyn Y and Butler Stephen P
Bought by
Butler Stephen P and Butler Robyn Y
Current Estimated Value
Home Financials for this Owner
Home Financials are based on the most recent Mortgage that was taken out on this home.
Original Mortgage
$85,000
Outstanding Balance
$38,111
Interest Rate
5.87%
Mortgage Type
Purchase Money Mortgage
Estimated Equity
$225,390
Purchase Details
Closed on
Jul 13, 2001
Sold by
Butler Ralph P
Bought by
Butler Robyn Tice
Purchase Details
Closed on
Aug 20, 1997
Sold by
Arnold Mark D
Bought by
Tice Robyn Yvette and Tice Robyn Y
Home Financials for this Owner
Home Financials are based on the most recent Mortgage that was taken out on this home.
Original Mortgage
$65,466
Interest Rate
7.47%
Mortgage Type
FHA
Create a Home Valuation Report for This Property
The Home Valuation Report is an in-depth analysis detailing your home's value as well as a comparison with similar homes in the area
Home Values in the Area
Average Home Value in this Area
Purchase History
| Date | Buyer | Sale Price | Title Company |
|---|---|---|---|
| Butler Stephen P | -- | -- | |
| Butler Robyn Tice | -- | -- | |
| Tice Robyn Yvette | -- | -- |
Source: Public Records
Mortgage History
| Date | Status | Borrower | Loan Amount |
|---|---|---|---|
| Open | Butler Stephen P | $85,000 | |
| Closed | Tice Robyn Yvette | $65,466 |
Source: Public Records
Tax History Compared to Growth
Tax History
| Year | Tax Paid | Tax Assessment Tax Assessment Total Assessment is a certain percentage of the fair market value that is determined by local assessors to be the total taxable value of land and additions on the property. | Land | Improvement |
|---|---|---|---|---|
| 2025 | $3,060 | $50,330 | $5,340 | $44,990 |
| 2024 | $3,060 | $35,060 | $3,060 | $32,000 |
| 2023 | $3,056 | $35,060 | $3,060 | $32,000 |
| 2022 | $3,307 | $33,840 | $3,520 | $30,320 |
| 2021 | $3,259 | $33,840 | $3,520 | $30,320 |
| 2020 | $2,524 | $24,340 | $3,520 | $20,820 |
| 2019 | $2,486 | $24,340 | $3,520 | $20,820 |
| 2018 | $2,199 | $19,780 | $2,410 | $17,370 |
| 2017 | $2,197 | $19,780 | $2,410 | $17,370 |
| 2016 | $2,302 | $20,460 | $2,790 | $17,670 |
| 2015 | $2,253 | $20,460 | $2,790 | $17,670 |
| 2014 | $1,923 | $17,960 | $3,520 | $14,440 |
Source: Public Records
Map
Nearby Homes
- 1834 Night Dr
- 2347 Farflung Dr
- 1767 Stilton Ct
- 2171 Farthing Ct
- 2216 Foggy Bottom Dr
- 2334 White Ash Ct
- 2314 White Ash Ct
- 2106 Kingsford Dr
- 1911 Suns Up Ct Unit 4
- 1907 High Sun Dr
- 2145 Flamingo Dr
- 1863 High Sun Dr Unit 51863
- 2 Meadows
- 2490 Mullanphy Ln
- 2112 New Sun Dr
- 2 Ashford at River Bluffs Manors
- 2 Berwick at River Bluffs Manors
- 1831 New Sun Ct Unit 5
- 2 Meadows
- 2 Maple at River Bluffs Manors
- 1904 Night Dr
- 1884 Night Dr
- 1874 Night Dr
- 1914 Night Dr
- 1875 Battlefield Dr
- 1865 Battlefield Dr
- 1864 Night Dr
- 1924 Night Dr
- 2389 Farflung Dr
- 1855 Battlefield Dr
- 1883 Night Dr
- 1854 Night Dr
- 1934 Night Dr
- 1845 Battlefield Dr
- 2383 Farflung Dr
- 1873 Night Dr
- 1853 Night Dr
- 1835 Battlefield Dr
- 2380 Farflung Dr
- 2377 Farflung Dr