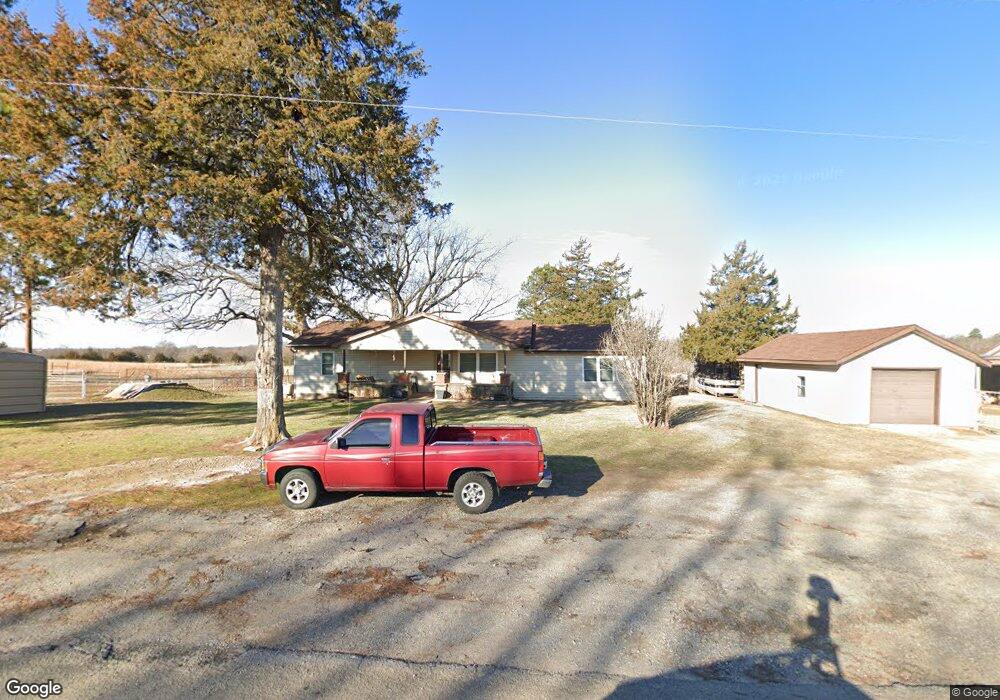
18958 S 337th West Ave Bristow, OK 74010
Estimated Value: $224,000 - $263,205
2
Beds
2
Baths
1,764
Sq Ft
$136/Sq Ft
Est. Value
About This Home
This home is located at 18958 S 337th West Ave, Bristow, OK 74010 and is currently estimated at $239,735, approximately $135 per square foot. 18958 S 337th West Ave is a home located in Creek County with nearby schools including Edison Elementary School, Collins Elementary School, and Bristow Middle School.
Ownership History
Date
Name
Owned For
Owner Type
Purchase Details
Closed on
Dec 20, 2024
Sold by
Willis Michael Dean and Willis Dawna Machelle
Bought by
Willis Michael Dean and Willis Dawna Machelle
Current Estimated Value
Purchase Details
Closed on
Nov 23, 2021
Sold by
Willis Michael Dean and Willis Dawna Machelle
Bought by
Willis Michael Dean and Willis Machelle
Purchase Details
Closed on
May 4, 2016
Sold by
Willis Willis Marvin Dee Marvin Dee and Willis Marvin Dee
Bought by
Willis Marvin Dee
Purchase Details
Closed on
Jan 30, 2013
Sold by
Willis Matt and Willis Amber
Bought by
Willis Marvin Dee and Willis Norma Alta
Purchase Details
Closed on
Oct 19, 2012
Sold by
Willis Marvin Dee
Bought by
Willis Matt and Willis Amebr
Purchase Details
Closed on
Nov 25, 2008
Sold by
Wills Marvin and Wills Norma
Bought by
Willis Marvin Dee and Willis Norma Alta
Create a Home Valuation Report for This Property
The Home Valuation Report is an in-depth analysis detailing your home's value as well as a comparison with similar homes in the area
Home Values in the Area
Average Home Value in this Area
Purchase History
| Date | Buyer | Sale Price | Title Company |
|---|---|---|---|
| Willis Michael Dean | -- | None Listed On Document | |
| Willis Michael Dean | -- | None Listed On Document | |
| Shelby Sharon Sue | $20,000 | None Listed On Document | |
| Willis Michael Dean | -- | None Available | |
| Willis Marvin Dee | -- | None Available | |
| Willis Marvin Dee | -- | None Available | |
| Willis Matt | -- | None Available | |
| Willis Marvin Dee | -- | -- |
Source: Public Records
Tax History Compared to Growth
Tax History
| Year | Tax Paid | Tax Assessment Tax Assessment Total Assessment is a certain percentage of the fair market value that is determined by local assessors to be the total taxable value of land and additions on the property. | Land | Improvement |
|---|---|---|---|---|
| 2025 | $700 | $8,118 | $185 | $7,933 |
| 2024 | $677 | $7,882 | $784 | $7,098 |
| 2023 | $677 | $7,653 | $775 | $6,878 |
| 2022 | $615 | $7,430 | $764 | $6,666 |
| 2021 | $596 | $7,213 | $753 | $6,460 |
| 2020 | $576 | $7,213 | $875 | $6,338 |
| 2019 | $580 | $7,213 | $915 | $6,298 |
| 2018 | $596 | $7,213 | $917 | $6,296 |
| 2017 | $598 | $7,213 | $917 | $6,296 |
| 2016 | $606 | $7,213 | $917 | $6,296 |
| 2015 | -- | $7,213 | $802 | $6,411 |
| 2014 | -- | $6,313 | $1,845 | $4,468 |
Source: Public Records
Map
Nearby Homes
- 18694 S 340 Ave W
- 19619 S 337th West Ave
- 0 W 181st St S Unit 2539521
- 32109 W Highway 66
- 17504 S 327th West Ave
- 51499 W Highway 66
- 00 S 369th West Ave
- 16605 State Highway 48
- 41377 W Highway 66
- West 211th St S
- 137 E 11th Ave
- 608 N Elm St
- 0 State Highway 48
- 302 E 8th Ave
- 619 E 6th Ave
- 551 W 10th Ave
- 28520 W 166th St S
- 34335 W Highway 16
- 106 N Main St
- 32380 W Highway 33
- 18899 S 337th West Ave
- 34047 W 191st St S
- 18811 S 337th West Ave
- 18811 S 337th West Ave
- 33701 W 191st St S
- 33701 W 191st St S Unit South
- 18770 S 337th West Ave
- 19091 S 337th West Ave
- 34043 W 191st St S
- 33690 W 191st St S
- 18708 S 337th West Ave
- 22970 S 340 Ave W
- 18694 S 340th West Place
- 18694 S 340th West Place
- 26483 W 191st St S
- 26100-A W 191st St S
- 26100-B W 191st St S
- 0 W 191st St S
- 34207 W 191st St S
- 33291 W 191st St S