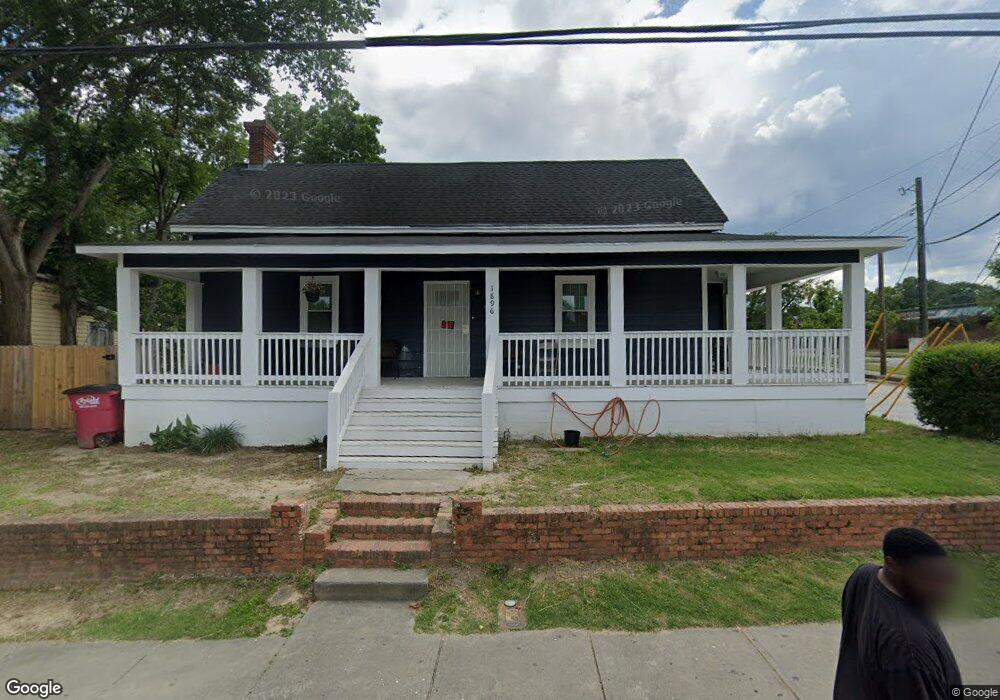
1896 3rd Ave Macon, GA 31201
Pleasant Hill Historic District NeighborhoodEstimated Value: $64,000 - $84,308
3
Beds
2
Baths
1,425
Sq Ft
$52/Sq Ft
Est. Value
About This Home
This home is located at 1896 3rd Ave, Macon, GA 31201 and is currently estimated at $74,077, approximately $51 per square foot. 1896 3rd Ave is a home located in Bibb County with nearby schools including Williams Elementary School, Miller Fine Arts Magnet Middle School, and Central High School.
Ownership History
Date
Name
Owned For
Owner Type
Purchase Details
Closed on
Jul 26, 2024
Sold by
Braddy Family Holdings Lllp
Bought by
Kcb Estates Llc
Current Estimated Value
Home Financials for this Owner
Home Financials are based on the most recent Mortgage that was taken out on this home.
Original Mortgage
$105,000
Outstanding Balance
$103,621
Interest Rate
6.87%
Mortgage Type
New Conventional
Estimated Equity
-$29,544
Purchase Details
Closed on
Jun 12, 2024
Sold by
Moore Dyann
Bought by
Braddy Family Holdings Lllp
Home Financials for this Owner
Home Financials are based on the most recent Mortgage that was taken out on this home.
Original Mortgage
$105,000
Outstanding Balance
$103,621
Interest Rate
6.87%
Mortgage Type
New Conventional
Estimated Equity
-$29,544
Purchase Details
Closed on
Jan 3, 2022
Sold by
Dyann Moore
Bought by
Braddy Family Holdings
Purchase Details
Closed on
Feb 13, 2001
Sold by
Duval William E
Bought by
Moore Dyann
Create a Home Valuation Report for This Property
The Home Valuation Report is an in-depth analysis detailing your home's value as well as a comparison with similar homes in the area
Home Values in the Area
Average Home Value in this Area
Purchase History
| Date | Buyer | Sale Price | Title Company |
|---|---|---|---|
| Kcb Estates Llc | -- | None Listed On Document | |
| Braddy Family Holdings Lllp | -- | None Listed On Document | |
| Braddy Family Holdings | $42,300 | None Listed On Document | |
| Moore Dyann | $85,000 | -- |
Source: Public Records
Mortgage History
| Date | Status | Borrower | Loan Amount |
|---|---|---|---|
| Open | Kcb Estates Llc | $105,000 |
Source: Public Records
Tax History
| Year | Tax Paid | Tax Assessment Tax Assessment Total Assessment is a certain percentage of the fair market value that is determined by local assessors to be the total taxable value of land and additions on the property. | Land | Improvement |
|---|---|---|---|---|
| 2025 | $609 | $24,797 | $2,160 | $22,637 |
| 2024 | $600 | $23,624 | $1,440 | $22,184 |
| 2023 | $501 | $22,706 | $1,200 | $21,506 |
| 2022 | $652 | $18,834 | $1,386 | $17,448 |
| 2021 | $642 | $16,899 | $1,320 | $15,579 |
| 2020 | $656 | $16,899 | $1,320 | $15,579 |
| 2019 | $662 | $16,899 | $1,320 | $15,579 |
| 2018 | $1,193 | $16,899 | $1,320 | $15,579 |
| 2017 | $633 | $16,899 | $1,320 | $15,579 |
| 2016 | $585 | $16,899 | $1,320 | $15,579 |
| 2015 | $806 | $16,468 | $1,320 | $15,148 |
| 2014 | $928 | $16,468 | $1,320 | $15,148 |
Source: Public Records
Map
Nearby Homes
Your Personal Tour Guide
Ask me questions while you tour the home.