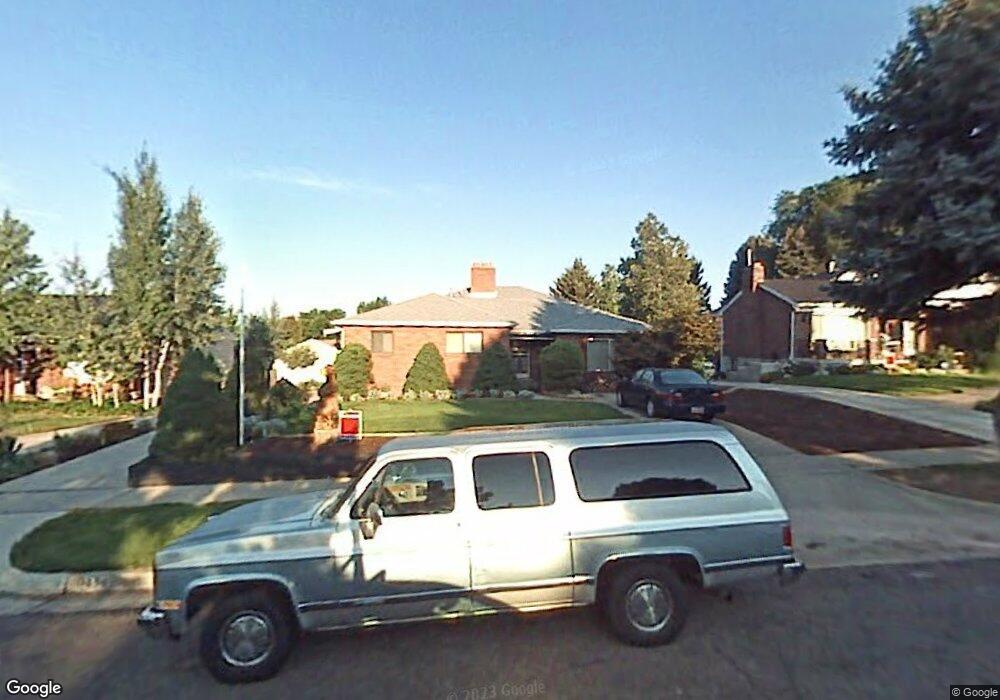
1896 Texas St Salt Lake City, UT 84108
Sugar House NeighborhoodEstimated Value: $848,000 - $1,050,201
5
Beds
3
Baths
1,891
Sq Ft
$521/Sq Ft
Est. Value
About This Home
This home is located at 1896 Texas St, Salt Lake City, UT 84108 and is currently estimated at $986,050, approximately $521 per square foot. 1896 Texas St is a home located in Salt Lake County with nearby schools including Beacon Heights School, Hillside Middle School, and Highland High School.
Ownership History
Date
Name
Owned For
Owner Type
Purchase Details
Closed on
Sep 14, 2020
Sold by
Owen Sara E
Bought by
Owen Sara
Current Estimated Value
Home Financials for this Owner
Home Financials are based on the most recent Mortgage that was taken out on this home.
Original Mortgage
$386,200
Outstanding Balance
$342,091
Interest Rate
2.8%
Mortgage Type
New Conventional
Estimated Equity
$643,959
Purchase Details
Closed on
Nov 28, 2016
Sold by
Looser Niklaus B and Looser Niklaus
Bought by
Owen Sara E
Home Financials for this Owner
Home Financials are based on the most recent Mortgage that was taken out on this home.
Original Mortgage
$432,725
Interest Rate
3.47%
Mortgage Type
New Conventional
Purchase Details
Closed on
Mar 31, 2004
Sold by
Looser Niklaus B and Looser Susanna E
Bought by
Looser Niklaus B and Looser Susanna E
Purchase Details
Closed on
Sep 6, 2002
Sold by
Looser Niklaus B and Looser Susanna E
Bought by
Looser Niklaus B and Looser Susanna E
Create a Home Valuation Report for This Property
The Home Valuation Report is an in-depth analysis detailing your home's value as well as a comparison with similar homes in the area
Home Values in the Area
Average Home Value in this Area
Purchase History
| Date | Buyer | Sale Price | Title Company |
|---|---|---|---|
| Owen Sara | -- | Us Title | |
| Owen Sara E | -- | Backman Title Services | |
| Looser Niklaus B | -- | -- | |
| Looser Niklaus B | -- | -- |
Source: Public Records
Mortgage History
| Date | Status | Borrower | Loan Amount |
|---|---|---|---|
| Open | Owen Sara | $386,200 | |
| Closed | Owen Sara E | $432,725 |
Source: Public Records
Tax History Compared to Growth
Tax History
| Year | Tax Paid | Tax Assessment Tax Assessment Total Assessment is a certain percentage of the fair market value that is determined by local assessors to be the total taxable value of land and additions on the property. | Land | Improvement |
|---|---|---|---|---|
| 2025 | $3,976 | $821,800 | $252,500 | $569,300 |
| 2024 | $3,976 | $758,600 | $240,900 | $517,700 |
| 2023 | $3,860 | $709,900 | $231,700 | $478,200 |
| 2022 | $4,070 | $702,300 | $227,100 | $475,200 |
| 2021 | $3,740 | $584,300 | $184,400 | $399,900 |
| 2020 | $3,732 | $555,000 | $172,400 | $382,600 |
| 2019 | $3,319 | $464,400 | $143,600 | $320,800 |
| 2018 | $3,329 | $453,600 | $143,600 | $310,000 |
| 2017 | $3,451 | $440,500 | $142,300 | $298,200 |
| 2016 | $2,898 | $351,300 | $142,300 | $209,000 |
| 2015 | $3,095 | $355,600 | $146,600 | $209,000 |
| 2014 | $2,269 | $258,600 | $146,600 | $112,000 |
Source: Public Records
Map
Nearby Homes
- 1940 S 2500 E
- 2225 Ramona Ave
- 2109 S Texas St
- 1974 Laurelhurst Dr E
- 1769 S Foothill Dr
- 2326 E 1700 S
- 2119 King St
- 1881 Foothill Dr
- 1876 S 2600 E
- 1908 S 2600 E
- 1825 S 2600 E
- 2366 Logan Ave S
- 2505 E Elm Ave
- 1802 S Wasatch Dr
- 2138 E Wilson Ave
- 2266 E Kensington Ave
- 2662 E Comanche Dr
- 1502 S 2400 E
- 2618 E Skyline Dr
- 2125 Logan Ave S
- 1896 S Texas St
- 1886 Texas St
- 1904 Texas St
- 1904 S Texas St
- 1910 Texas St
- 1910 S Texas St
- 1874 S Texas St
- 1874 Texas St
- 1893 Nevada St
- 1893 S Nevada St
- 1889 Nevada St
- 1903 Nevada St
- 1916 Texas St
- 1916 S Texas St
- 1881 Nevada St
- 1924 Texas St
- 1915 Nevada St
- 1903 S Texas St
- 1915 S Nevada St
- 1895 S Texas St