Estimated Value: $344,872 - $394,000
2
Beds
1
Bath
1,367
Sq Ft
$269/Sq Ft
Est. Value
About This Home
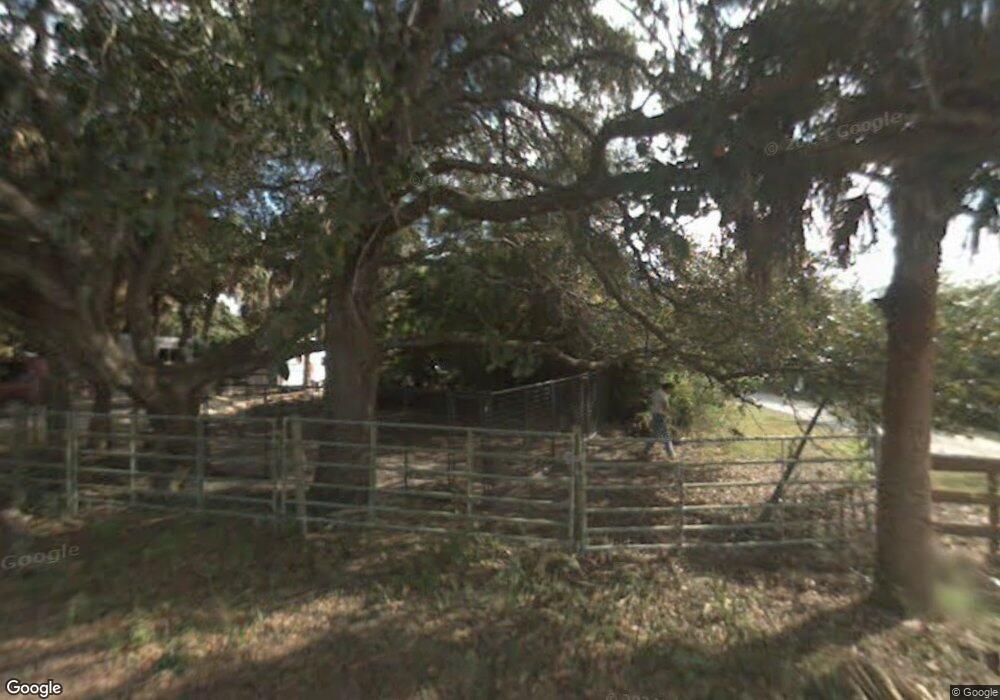
This home is located at 18960 Fox Run Rd, Alva, FL 33920 and is currently estimated at $367,468, approximately $268 per square foot. 18960 Fox Run Rd is a home with nearby schools including The Alva School, Orange River Elementary School, and Tice Elementary School.
Ownership History
Date
Name
Owned For
Owner Type
Purchase Details
Closed on
Jan 25, 2021
Sold by
Taghan Archie R and Taghan Patricia A
Bought by
Lippke Michael P
Current Estimated Value
Purchase Details
Closed on
Dec 31, 2019
Sold by
Spence Richard
Bought by
Lippke Michael P
Purchase Details
Closed on
May 2, 2018
Sold by
Whitaker Catherine E and Clifton Catherine
Bought by
Spence Richard
Home Financials for this Owner
Home Financials are based on the most recent Mortgage that was taken out on this home.
Original Mortgage
$150,000
Interest Rate
4.4%
Mortgage Type
Unknown
Purchase Details
Closed on
Jan 30, 2002
Sold by
Clifton Robert
Bought by
Clifton Catherine
Purchase Details
Closed on
Jun 12, 2000
Sold by
Ousley Robert E and Ousley Frances L
Bought by
Clifton Catherine E
Create a Home Valuation Report for This Property
The Home Valuation Report is an in-depth analysis detailing your home's value as well as a comparison with similar homes in the area
Home Values in the Area
Average Home Value in this Area
Purchase History
| Date | Buyer | Sale Price | Title Company |
|---|---|---|---|
| Lippke Michael P | $10,000 | Florida Title & Guarantee Agen | |
| Lippke Michael P | $220,000 | Pro Title Of Florida Inc | |
| Spence Richard | $185,000 | Pro Title Of Florida Inc | |
| Clifton Catherine | -- | -- | |
| Clifton Catherine E | $88,000 | -- |
Source: Public Records
Mortgage History
| Date | Status | Borrower | Loan Amount |
|---|---|---|---|
| Previous Owner | Spence Richard | $150,000 |
Source: Public Records
Tax History Compared to Growth
Tax History
| Year | Tax Paid | Tax Assessment Tax Assessment Total Assessment is a certain percentage of the fair market value that is determined by local assessors to be the total taxable value of land and additions on the property. | Land | Improvement |
|---|---|---|---|---|
| 2025 | $1,497 | $124,291 | -- | -- |
| 2024 | $1,497 | $120,788 | -- | -- |
| 2023 | $1,443 | $117,270 | $0 | $0 |
| 2022 | $1,594 | $113,854 | $0 | $0 |
| 2021 | $1,529 | $115,723 | $58,170 | $57,553 |
| 2020 | $1,444 | $109,012 | $54,292 | $54,720 |
| 2019 | $2,375 | $141,307 | $54,292 | $87,015 |
| 2018 | $2,439 | $142,927 | $54,292 | $88,635 |
| 2017 | $2,408 | $138,075 | $35,179 | $102,896 |
| 2016 | $815 | $129,379 | $13,459 | $115,920 |
| 2015 | $814 | $61,765 | $13,318 | $48,447 |
| 2014 | $792 | $60,741 | $13,120 | $47,621 |
| 2013 | -- | $63,092 | $13,077 | $50,015 |
Source: Public Records
Map
Nearby Homes
- 634 Jackie Ct
- 625 Greenbriar Blvd
- 644 Kleinart Dr
- 1951 Mariano St
- 658 Morella Ave
- 1934 Wingford Dr
- 630 Loleta Ct
- 1959 Walcott Loop
- 1998 Walcott Loop
- 1957 Walcott Loop
- 1989 Walcott Loop
- 629 Lombardy Ct
- 627 Lombardy Ct
- 1928 Mary Lee St
- 1914 Stephens St
- 601 Loleta Ct
- 1915 Index Ct
- 547 Greenbriar Blvd
- 545 Greenbriar Blvd
- 641 Jeffries St
- 18991 Fox Run Rd
- 3771 Bateman Rd
- 18921 Fox Run Rd
- 18890 Fox Run Rd
- 18891 Fox Run Rd
- 3751 Bateman Rd
- 19040 Fox Run Rd
- 19041 Fox Run Rd
- 3781 Bateman Rd
- 3671 Bateman Rd
- 3661 Bateman Rd
- 3651 Bateman Rd
- 3501 Bateman Rd
- 3711 Bateman Rd
- 3641 Bateman Rd
- 3441 Bateman Rd
- 3421 Bateman Rd
- 3401 Bateman Rd
- 3301 Bateman Rd
- 3001 Bateman Rd