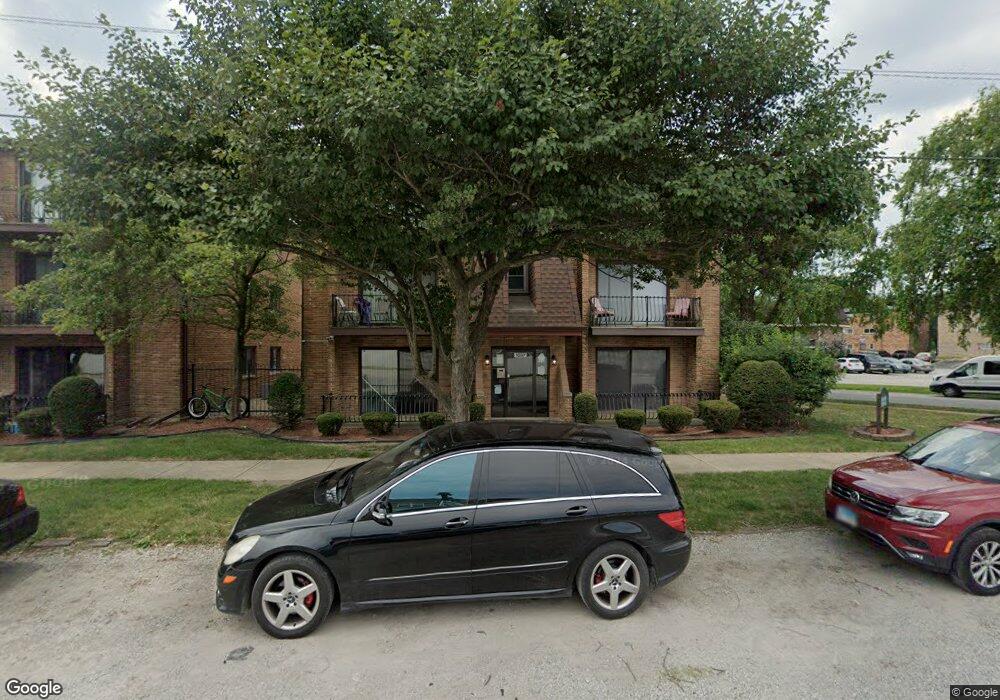
1897 Michigan City Rd Unit 188 Calumet City, IL 60409
Estimated Value: $72,184 - $96,000
2
Beds
1
Bath
903
Sq Ft
$90/Sq Ft
Est. Value
About This Home
This home is located at 1897 Michigan City Rd Unit 188, Calumet City, IL 60409 and is currently estimated at $81,296, approximately $90 per square foot. 1897 Michigan City Rd Unit 188 is a home located in Cook County with nearby schools including Diekman Elementary School, Carol Moseley Braun School, and Creative Communications Academy.
Ownership History
Date
Name
Owned For
Owner Type
Purchase Details
Closed on
May 14, 2014
Sold by
Young Emanuel and Gresham Young Carolyn
Bought by
Young Emanuel
Current Estimated Value
Purchase Details
Closed on
Sep 18, 2007
Sold by
Young Emanuel and Young Carolyn
Bought by
Young Emanuel and Young Carolyn
Home Financials for this Owner
Home Financials are based on the most recent Mortgage that was taken out on this home.
Original Mortgage
$55,500
Outstanding Balance
$35,103
Interest Rate
6.55%
Mortgage Type
Stand Alone Refi Refinance Of Original Loan
Estimated Equity
$46,193
Purchase Details
Closed on
Jan 9, 2004
Sold by
Webb Katie R
Bought by
Young Emanuel
Home Financials for this Owner
Home Financials are based on the most recent Mortgage that was taken out on this home.
Original Mortgage
$55,775
Interest Rate
5.46%
Mortgage Type
Purchase Money Mortgage
Create a Home Valuation Report for This Property
The Home Valuation Report is an in-depth analysis detailing your home's value as well as a comparison with similar homes in the area
Home Values in the Area
Average Home Value in this Area
Purchase History
| Date | Buyer | Sale Price | Title Company |
|---|---|---|---|
| Young Emanuel | -- | None Available | |
| Young Emanuel | -- | Lawyers Title Insurance Corp | |
| Young Emanuel | $57,500 | Lawyers Title Ins |
Source: Public Records
Mortgage History
| Date | Status | Borrower | Loan Amount |
|---|---|---|---|
| Open | Young Emanuel | $55,500 | |
| Previous Owner | Young Emanuel | $55,775 |
Source: Public Records
Tax History Compared to Growth
Tax History
| Year | Tax Paid | Tax Assessment Tax Assessment Total Assessment is a certain percentage of the fair market value that is determined by local assessors to be the total taxable value of land and additions on the property. | Land | Improvement |
|---|---|---|---|---|
| 2024 | $3,202 | $5,128 | $482 | $4,646 |
| 2023 | $2,734 | $5,128 | $482 | $4,646 |
| 2022 | $2,734 | $3,455 | $425 | $3,030 |
| 2021 | $2,575 | $3,454 | $425 | $3,029 |
| 2020 | $2,348 | $3,454 | $425 | $3,029 |
| 2019 | $3,162 | $4,283 | $397 | $3,886 |
| 2018 | $3,148 | $4,283 | $397 | $3,886 |
| 2017 | $3,018 | $4,283 | $397 | $3,886 |
| 2016 | $2,097 | $3,143 | $368 | $2,775 |
| 2015 | $2,048 | $3,143 | $368 | $2,775 |
| 2014 | $1,993 | $3,143 | $368 | $2,775 |
| 2013 | $2,873 | $4,837 | $368 | $4,469 |
Source: Public Records
Map
Nearby Homes
- 669 Chappel Ave Unit 2C
- 669 Chappel Ave Unit 2B
- 1918 Stonegate Dr
- 602 Merrill Ave
- 627 Paxton Ave
- 15117 Madison Ave
- 1758 Memorial Dr
- 513 Merrill Ave
- 15112 E End Ave
- 15435 Merrill Ave
- 519 Paxton Ave
- 451 Clyde Ave
- 454 Madison Ave
- 530 Bensley Ave
- 427 Clyde Ave
- 15333 Dante Ave
- 428 Paxton Ave
- 442 Prairie Ave
- 15332 Dante Ave
- 15228 Dante Ave
- 1897 Michigan City Rd Unit 189
- 1897 Michigan City Rd Unit 189
- 1897 Michigan City Rd Unit 189
- 1897 Michigan City Rd Unit 183
- 1897 Michigan City Rd Unit 189
- 1897 Michigan City Rd
- 1897 Michigan City Rd Unit 1E
- 1893 Michigan City Rd Unit 189
- 1893 Michigan City Rd Unit 189
- 1893 Michigan City Rd Unit 189
- 1893 Michigan City Rd Unit 189
- 1893 Michigan City Rd Unit 189
- 1893 Michigan City Rd Unit 189
- 1893 Michigan City Rd Unit 6
- 1893 Michigan City Rd Unit 3E
- 1893 Michigan City Rd Unit 1E
- 1893 Michigan City Rd Unit 1
- 1893 Michigan City Rd Unit 2W
- 1889 Michigan City Rd Unit 18895
- 1889 Michigan City Rd Unit 188