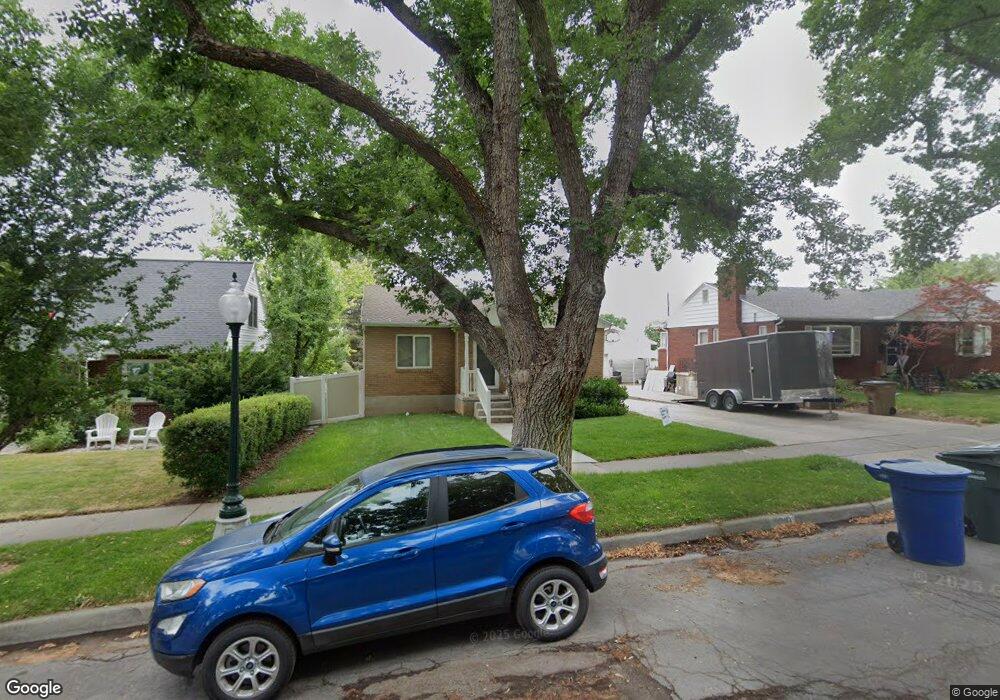
1898 S Nevada St Salt Lake City, UT 84108
Sugar House NeighborhoodEstimated Value: $665,000 - $767,000
4
Beds
2
Baths
1,808
Sq Ft
$394/Sq Ft
Est. Value
About This Home
This home is located at 1898 S Nevada St, Salt Lake City, UT 84108 and is currently estimated at $712,885, approximately $394 per square foot. 1898 S Nevada St is a home located in Salt Lake County with nearby schools including Beacon Heights School, Hillside Middle School, and Highland High School.
Ownership History
Date
Name
Owned For
Owner Type
Purchase Details
Closed on
Feb 20, 2013
Sold by
Lammie Wayne and Stone Marci
Bought by
Stone Marci and Lammie Wayne
Current Estimated Value
Home Financials for this Owner
Home Financials are based on the most recent Mortgage that was taken out on this home.
Original Mortgage
$231,550
Outstanding Balance
$104,353
Interest Rate
3.36%
Mortgage Type
New Conventional
Estimated Equity
$608,532
Purchase Details
Closed on
Jan 4, 2011
Sold by
Anderson Heidi G
Bought by
Lammie Wayne and Stone Marci
Home Financials for this Owner
Home Financials are based on the most recent Mortgage that was taken out on this home.
Original Mortgage
$240,350
Interest Rate
4.35%
Mortgage Type
New Conventional
Purchase Details
Closed on
Feb 27, 1997
Sold by
Davis Paul R and Davis Marjie L
Bought by
Anderson Heidi A
Home Financials for this Owner
Home Financials are based on the most recent Mortgage that was taken out on this home.
Original Mortgage
$132,000
Interest Rate
7.86%
Create a Home Valuation Report for This Property
The Home Valuation Report is an in-depth analysis detailing your home's value as well as a comparison with similar homes in the area
Home Values in the Area
Average Home Value in this Area
Purchase History
| Date | Buyer | Sale Price | Title Company |
|---|---|---|---|
| Stone Marci | -- | Sutherland Title | |
| Lammie Wayne | -- | First American Title | |
| Anderson Heidi A | -- | -- |
Source: Public Records
Mortgage History
| Date | Status | Borrower | Loan Amount |
|---|---|---|---|
| Open | Stone Marci | $231,550 | |
| Closed | Lammie Wayne | $240,350 | |
| Previous Owner | Anderson Heidi A | $132,000 |
Source: Public Records
Tax History Compared to Growth
Tax History
| Year | Tax Paid | Tax Assessment Tax Assessment Total Assessment is a certain percentage of the fair market value that is determined by local assessors to be the total taxable value of land and additions on the property. | Land | Improvement |
|---|---|---|---|---|
| 2025 | $3,038 | $628,900 | $238,300 | $390,600 |
| 2024 | $3,038 | $579,700 | $227,400 | $352,300 |
| 2023 | $2,963 | $545,000 | $218,700 | $326,300 |
| 2022 | $3,145 | $542,700 | $214,400 | $328,300 |
| 2021 | $2,879 | $449,800 | $174,100 | $275,700 |
| 2020 | $2,869 | $426,600 | $162,700 | $263,900 |
| 2019 | $2,398 | $335,500 | $135,500 | $200,000 |
| 2018 | $2,405 | $327,600 | $135,500 | $192,100 |
| 2017 | $2,499 | $318,900 | $135,500 | $183,400 |
| 2016 | $2,633 | $319,100 | $135,500 | $183,600 |
| 2015 | $2,575 | $295,800 | $139,600 | $156,200 |
| 2014 | $2,378 | $271,000 | $139,600 | $131,400 |
Source: Public Records
Map
Nearby Homes
- 2225 Ramona Ave
- 1940 S 2500 E
- 2109 S Texas St
- 2119 King St
- 2326 E 1700 S
- 1974 Laurelhurst Dr E
- 2138 E Wilson Ave
- 1769 S Foothill Dr
- 1881 Foothill Dr
- 1876 S 2600 E
- 1908 S 2600 E
- 2366 Logan Ave S
- 2505 E Elm Ave
- 1825 S 2600 E
- 1802 S Wasatch Dr
- 2009 E Hollywood Ave
- 2125 Logan Ave S
- 2266 E Kensington Ave
- 1980 Downington Ave S
- 1502 S 2400 E
- 1898 Nevada St
- 1890 Nevada St
- 1902 Nevada St
- 1882 Nevada St
- 1912 Nevada St
- 2336 E Garfield Ave
- 1872 Nevada St
- 1918 Nevada St
- 1897 S 2300 E
- 2352 Garfield Ave
- 1903 S 2300 E
- 1887 S 2300 E Unit 1891
- 1911 S 2300 E
- 1883 S 2300 E
- 1924 Nevada St
- 1891 S 2300 E
- 1924 E Nevada St
- 1893 S Nevada St
- 1893 Nevada St
- 1917 S 2300 E