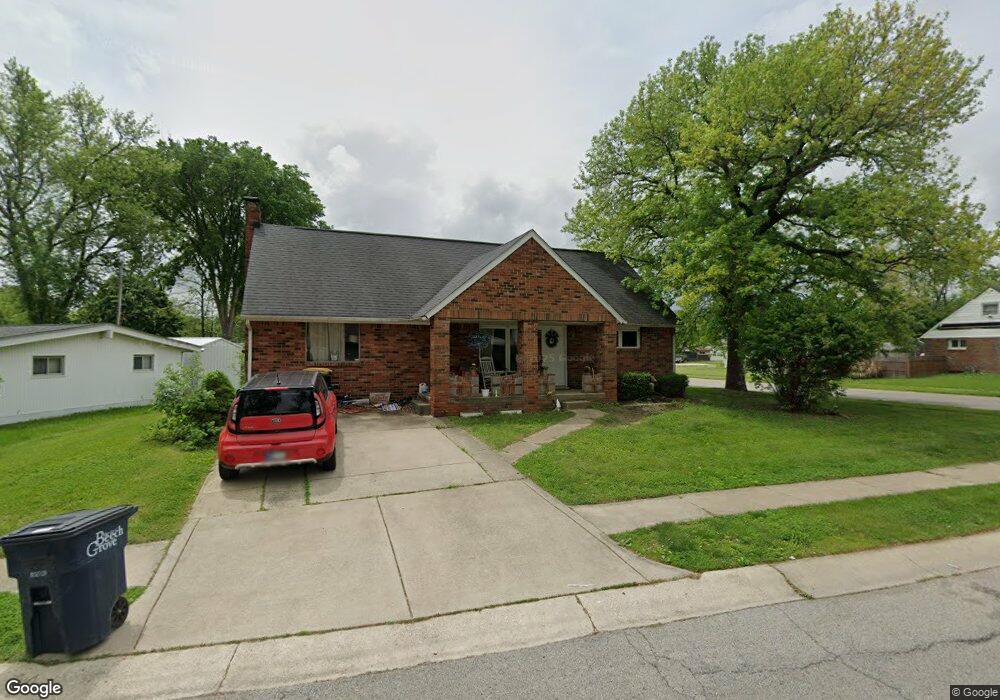
1899 Alton St Beech Grove, IN 46107
Estimated Value: $208,000 - $220,000
3
Beds
1
Bath
1,520
Sq Ft
$141/Sq Ft
Est. Value
About This Home
This home is located at 1899 Alton St, Beech Grove, IN 46107 and is currently estimated at $214,311, approximately $140 per square foot. 1899 Alton St is a home located in Marion County with nearby schools including Hornet Park Elementary School, Central Elementary School, and South Grove Intermediate School.
Ownership History
Date
Name
Owned For
Owner Type
Purchase Details
Closed on
May 21, 2013
Sold by
Andrews Claire R
Current Estimated Value
Purchase Details
Closed on
Dec 21, 2006
Sold by
Carpenter Steven
Bought by
Dellehay David L and Andrews Claire R
Home Financials for this Owner
Home Financials are based on the most recent Mortgage that was taken out on this home.
Original Mortgage
$96,900
Interest Rate
6.24%
Mortgage Type
New Conventional
Purchase Details
Closed on
Sep 1, 2006
Sold by
Jackson Alphonso and Secretary Of Hud
Bought by
Carpenter Steven
Home Financials for this Owner
Home Financials are based on the most recent Mortgage that was taken out on this home.
Original Mortgage
$52,000
Interest Rate
6.58%
Mortgage Type
New Conventional
Purchase Details
Closed on
Jan 20, 2006
Sold by
Countrywide Home Loans Inc
Bought by
Secretary Of Hud
Purchase Details
Closed on
Dec 31, 2005
Sold by
Norton Terri
Bought by
Countrywide Home Loans Inc
Create a Home Valuation Report for This Property
The Home Valuation Report is an in-depth analysis detailing your home's value as well as a comparison with similar homes in the area
Home Values in the Area
Average Home Value in this Area
Purchase History
| Date | Buyer | Sale Price | Title Company |
|---|---|---|---|
| -- | -- | -- | |
| Dellehay David L | -- | None Available | |
| Carpenter Steven | -- | None Available | |
| Secretary Of Hud | -- | None Available | |
| Countrywide Home Loans Inc | $110,432 | None Available |
Source: Public Records
Mortgage History
| Date | Status | Borrower | Loan Amount |
|---|---|---|---|
| Previous Owner | Dellehay David L | $96,900 | |
| Previous Owner | Carpenter Steven | $52,000 |
Source: Public Records
Tax History
| Year | Tax Paid | Tax Assessment Tax Assessment Total Assessment is a certain percentage of the fair market value that is determined by local assessors to be the total taxable value of land and additions on the property. | Land | Improvement |
|---|---|---|---|---|
| 2025 | $2,615 | $210,700 | $18,400 | $192,300 |
| 2024 | $2,378 | $193,000 | $18,400 | $174,600 |
| 2023 | $2,378 | $176,700 | $18,400 | $158,300 |
| 2022 | $2,263 | $162,800 | $18,400 | $144,400 |
| 2021 | $1,757 | $133,500 | $18,400 | $115,100 |
| 2020 | $1,582 | $127,500 | $18,400 | $109,100 |
| 2019 | $1,274 | $107,900 | $13,800 | $94,100 |
| 2018 | $1,201 | $104,800 | $13,800 | $91,000 |
| 2017 | $1,088 | $94,100 | $13,800 | $80,300 |
| 2016 | $1,014 | $89,000 | $13,800 | $75,200 |
| 2014 | $991 | $90,000 | $13,800 | $76,200 |
| 2013 | $971 | $88,400 | $13,800 | $74,600 |
Source: Public Records
Map
Nearby Homes
- 1901 Main St
- 2118 Newcomer Ln
- 1611 Main St
- 39 N 18th Ave
- 296 Ticen St
- 2021 Ticen Ct
- 225 Clark Ave
- 1526 Main St
- 298 Clark Ave
- 69 N 16th Ave
- 2215 Albany St
- 3106 E Sumner Ave
- 306 N 18th Ave
- 1005 Main St
- 304 Cleveland St
- 1146 Timber Grove Place
- 3830 S Olney St
- 2832 S Oakland Ave
- 3011 Cameron St
- 415 N 18th Ave
Your Personal Tour Guide
Ask me questions while you tour the home.