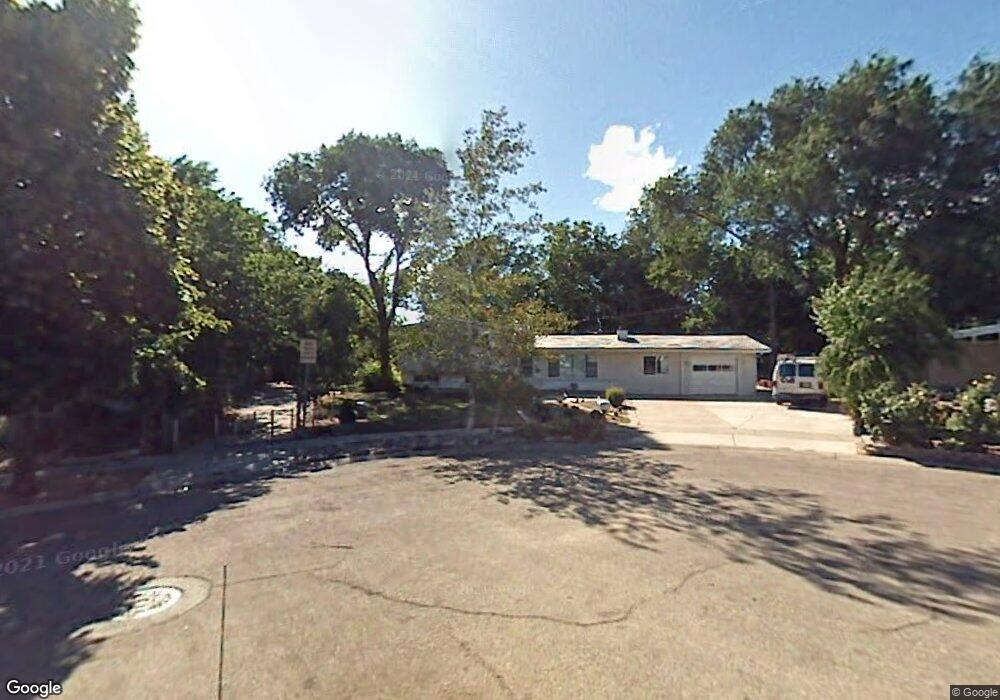
1899 Cecelia Cir Salt Lake City, UT 84121
Estimated Value: $678,208 - $727,000
4
Beds
2
Baths
1,418
Sq Ft
$498/Sq Ft
Est. Value
About This Home
This home is located at 1899 Cecelia Cir, Salt Lake City, UT 84121 and is currently estimated at $705,552, approximately $497 per square foot. 1899 Cecelia Cir is a home located in Salt Lake County with nearby schools including Oakwood Elementary School, Bonneville Junior High School, and Cottonwood High School.
Ownership History
Date
Name
Owned For
Owner Type
Purchase Details
Closed on
Oct 14, 2008
Sold by
Hathaway Peggy L and Cornia Peggy L
Bought by
Mendenhall Mark D
Current Estimated Value
Home Financials for this Owner
Home Financials are based on the most recent Mortgage that was taken out on this home.
Original Mortgage
$238,901
Outstanding Balance
$157,946
Interest Rate
6.31%
Mortgage Type
FHA
Estimated Equity
$547,606
Purchase Details
Closed on
Oct 9, 2008
Sold by
Cornia Clayton
Bought by
Hathaway Peggy L
Home Financials for this Owner
Home Financials are based on the most recent Mortgage that was taken out on this home.
Original Mortgage
$238,901
Outstanding Balance
$157,946
Interest Rate
6.31%
Mortgage Type
FHA
Estimated Equity
$547,606
Purchase Details
Closed on
Aug 26, 1998
Sold by
Cook David J
Bought by
Hathaway Peggy L and Hathaway Joel E
Purchase Details
Closed on
Aug 7, 1998
Sold by
Hathaway Peggy L and Hathaway Joel E
Bought by
Hathaway Peggy L and Cornia Clayton
Create a Home Valuation Report for This Property
The Home Valuation Report is an in-depth analysis detailing your home's value as well as a comparison with similar homes in the area
Home Values in the Area
Average Home Value in this Area
Purchase History
| Date | Buyer | Sale Price | Title Company |
|---|---|---|---|
| Mendenhall Mark D | -- | Paramount Title | |
| Hathaway Peggy L | -- | Paramount Title | |
| Hathaway Peggy L | -- | -- | |
| Hathaway Peggy L | -- | -- |
Source: Public Records
Mortgage History
| Date | Status | Borrower | Loan Amount |
|---|---|---|---|
| Open | Mendenhall Mark D | $238,901 |
Source: Public Records
Tax History Compared to Growth
Tax History
| Year | Tax Paid | Tax Assessment Tax Assessment Total Assessment is a certain percentage of the fair market value that is determined by local assessors to be the total taxable value of land and additions on the property. | Land | Improvement |
|---|---|---|---|---|
| 2025 | $3,090 | $621,200 | $271,000 | $350,200 |
| 2024 | $3,090 | $559,700 | $262,700 | $297,000 |
| 2023 | $2,951 | $520,800 | $208,900 | $311,900 |
| 2022 | $2,839 | $506,600 | $204,800 | $301,800 |
| 2021 | $2,735 | $424,000 | $180,200 | $243,800 |
| 2020 | $2,615 | $402,000 | $176,100 | $225,900 |
| 2019 | $2,596 | $388,900 | $165,400 | $223,500 |
| 2018 | $2,469 | $357,900 | $165,400 | $192,500 |
| 2017 | $2,204 | $337,700 | $165,400 | $172,300 |
| 2016 | $2,082 | $320,900 | $165,400 | $155,500 |
| 2015 | $1,499 | $215,500 | $177,000 | $38,500 |
| 2014 | $1,461 | $206,800 | $177,000 | $29,800 |
Source: Public Records
Map
Nearby Homes
- 1963 E Charleston Ln
- 5946 S Highland Dr
- 5625 S Dunetree Hill Ln
- 5608 S Dunetree Hill Ln
- 5780 S Minden Dr
- 5841 S Fontaine Bleu Cir
- 1694 E Cannes Way
- 2138 E Pheasant Ln
- 2105 Fardown Ave S
- 2113 E Fardown Ave
- 2062 E Walker Ln
- 6048 S 2075 E
- 6056 S 2075 E
- 2225 Fardown Ave S
- 1557 E Waterbury Dr Unit A
- 1876 Jeremy Ct
- 1574 E Winward Dr
- 5820 S Waterbury Way Unit H
- 5809 S Waterbury Dr Unit D
- 2209 E Fardown Ave
- 1899 E Cecelia Cir
- 1902 E Cecelia Cir
- 1902 E Cecelia Cir
- 1903 Cecelia Cir
- 1867 E Beaumont Cir
- 1867 Beaumont Cir
- 1911 Cecelia Cir
- 1855 Frontier Rd S
- 1908 Cecelia Cir
- 1908 E Cecelia Cir
- 1866 Beaumont Cir
- 1855 Frontier Rd
- 1871 Frontier Rd
- 1861 Beaumont Cir
- 1912 Cecelia Cir
- 1917 Cecelia Cir
- 1912 E Cecelia Cir
- 1845 E Frontier Rd
- 1891 Frontier Rd
- 1872 Laurelwood Cir