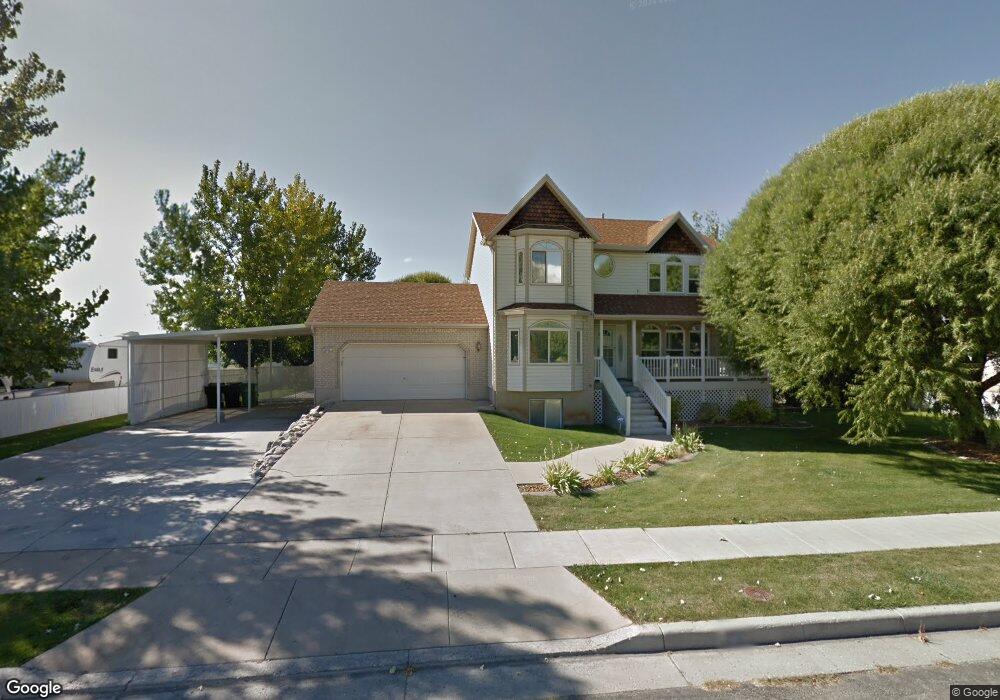
1899 N 3675 W Clearfield, UT 84015
Estimated Value: $658,000 - $754,000
5
Beds
4
Baths
2,708
Sq Ft
$256/Sq Ft
Est. Value
About This Home
This home is located at 1899 N 3675 W, Clearfield, UT 84015 and is currently estimated at $694,300, approximately $256 per square foot. 1899 N 3675 W is a home located in Davis County with nearby schools including West Point School, West Point Junior High School, and Syracuse High School.
Ownership History
Date
Name
Owned For
Owner Type
Purchase Details
Closed on
Jun 20, 2014
Sold by
Jacobs Dylan P
Bought by
Jacobs Dylan P and Jacobs Jody A
Current Estimated Value
Home Financials for this Owner
Home Financials are based on the most recent Mortgage that was taken out on this home.
Original Mortgage
$280,330
Outstanding Balance
$212,904
Interest Rate
4.16%
Mortgage Type
New Conventional
Estimated Equity
$481,396
Purchase Details
Closed on
Jun 10, 2011
Sold by
Jolley Brad D and Jolley Teresa J
Bought by
Frock Eileen
Home Financials for this Owner
Home Financials are based on the most recent Mortgage that was taken out on this home.
Original Mortgage
$245,854
Interest Rate
4.71%
Mortgage Type
VA
Purchase Details
Closed on
Jan 2, 2002
Sold by
Vankomen Robert H
Bought by
Jolley Brad D and Jolley Teresa J
Purchase Details
Closed on
Dec 30, 1998
Sold by
Vankomen Robert H
Bought by
Vankomen Robert H
Create a Home Valuation Report for This Property
The Home Valuation Report is an in-depth analysis detailing your home's value as well as a comparison with similar homes in the area
Home Values in the Area
Average Home Value in this Area
Purchase History
| Date | Buyer | Sale Price | Title Company |
|---|---|---|---|
| Jacobs Dylan P | -- | Security Title Of | |
| Jacobs Dylan P | -- | Cornerstone Title Ins | |
| Frock Eileen | -- | Backman Title Servi | |
| Jolley Brad D | -- | Bonneville Title Company Inc | |
| Vankomen Robert H | -- | Bonneville Title Company |
Source: Public Records
Mortgage History
| Date | Status | Borrower | Loan Amount |
|---|---|---|---|
| Open | Jacobs Dylan P | $280,330 | |
| Previous Owner | Frock Eileen | $245,854 |
Source: Public Records
Tax History Compared to Growth
Tax History
| Year | Tax Paid | Tax Assessment Tax Assessment Total Assessment is a certain percentage of the fair market value that is determined by local assessors to be the total taxable value of land and additions on the property. | Land | Improvement |
|---|---|---|---|---|
| 2025 | $3,756 | $352,000 | $171,288 | $180,712 |
| 2024 | $3,500 | $329,450 | $153,844 | $175,606 |
| 2023 | $3,315 | $574,000 | $215,085 | $358,915 |
| 2022 | $3,644 | $345,400 | $118,979 | $226,421 |
| 2021 | $3,287 | $466,000 | $159,587 | $306,413 |
| 2020 | $2,644 | $370,000 | $138,583 | $231,417 |
| 2019 | $2,522 | $348,000 | $133,091 | $214,909 |
| 2018 | $2,353 | $320,000 | $123,476 | $196,524 |
| 2016 | $2,227 | $159,335 | $48,184 | $111,151 |
| 2015 | $2,118 | $143,605 | $48,184 | $95,421 |
| 2014 | $2,193 | $150,772 | $48,184 | $102,588 |
| 2013 | -- | $111,089 | $43,156 | $67,933 |
Source: Public Records
Map
Nearby Homes
- 3656 W 1800 N
- 2118 Snowy Crane Dr
- Torino Farmhouse Plan at Cranefield Estates
- 2000 Traditional Plan at Cranefield Estates - Estates Collection
- Murano Traditional Plan at Cranefield Estates - Estates Collection
- 2400 Farmhouse Plan at Cranefield Estates - Estates Collection
- 1825 Traditional Plan at Cranefield Estates - Estates Collection
- 1550 Craftsman Plan at Cranefield Estates - Estates Collection
- 2050 Craftsman Plan at Cranefield Estates - Estates Collection
- Murano Traditional Plan at Cranefield Estates
- San Marino Traditional Plan at Cranefield Estates
- 3000 Traditional Plan at Cranefield Estates - Estates Collection
- 2000 Farmhouse Plan at Cranefield Estates - Estates Collection
- 2500 Traditional Plan at Cranefield Estates - Estates Collection
- 2000 Garden Plan at Cranefield Estates - Estates Collection
- 2413 N Eurasian Crane Rd
- 3762 W 2300 N
- 3784 W 2300 N
- 3892 W 1450 N
- 339 N 3250 W Unit 12