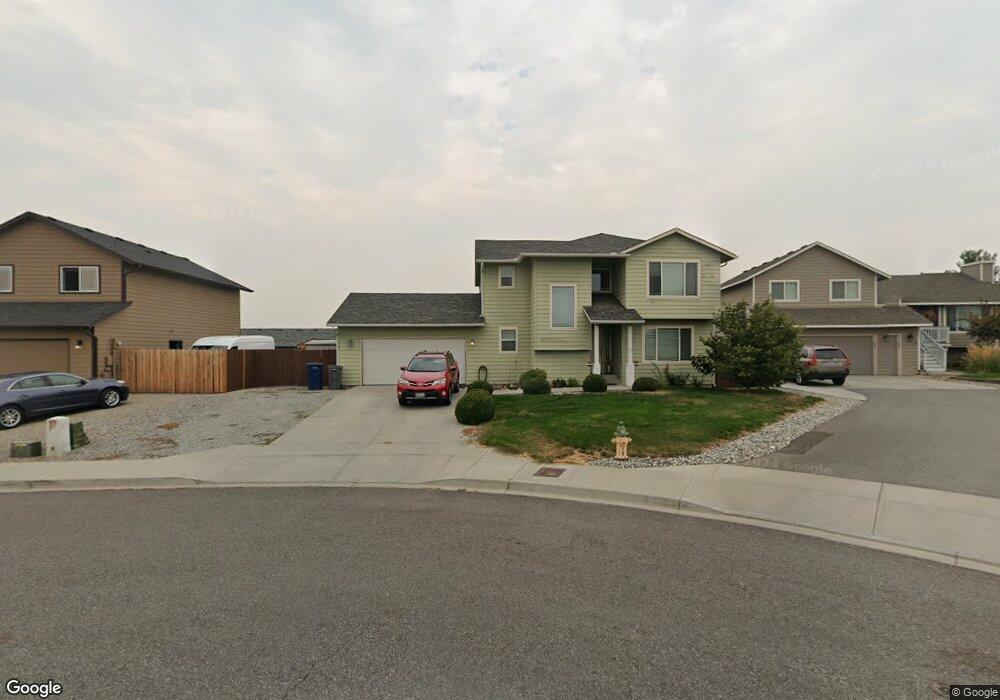
1899 Silks Ct East Wenatchee, WA 98802
Estimated Value: $519,579 - $598,000
4
Beds
3
Baths
1,832
Sq Ft
$304/Sq Ft
Est. Value
About This Home
This home is located at 1899 Silks Ct, East Wenatchee, WA 98802 and is currently estimated at $556,395, approximately $303 per square foot. 1899 Silks Ct is a home located in Douglas County with nearby schools including Clovis Point Intermediate School, Grant Elementary School, and Eastmont Junior High School.
Ownership History
Date
Name
Owned For
Owner Type
Purchase Details
Closed on
Sep 25, 2015
Sold by
Carey Joseph A and Carey Jennifer L
Bought by
Vidal Estela Sosa
Current Estimated Value
Home Financials for this Owner
Home Financials are based on the most recent Mortgage that was taken out on this home.
Original Mortgage
$217,000
Outstanding Balance
$170,849
Interest Rate
3.9%
Mortgage Type
New Conventional
Estimated Equity
$385,546
Purchase Details
Closed on
Aug 11, 2006
Sold by
Kentucky Crossing Llc
Bought by
Carey Ii Joseph A and Carey Jennifer L
Home Financials for this Owner
Home Financials are based on the most recent Mortgage that was taken out on this home.
Original Mortgage
$162,400
Interest Rate
6.76%
Mortgage Type
New Conventional
Create a Home Valuation Report for This Property
The Home Valuation Report is an in-depth analysis detailing your home's value as well as a comparison with similar homes in the area
Home Values in the Area
Average Home Value in this Area
Purchase History
| Date | Buyer | Sale Price | Title Company |
|---|---|---|---|
| Vidal Estela Sosa | $272,000 | Central Washington Title Co | |
| Carey Ii Joseph A | $43,000 | First American Title |
Source: Public Records
Mortgage History
| Date | Status | Borrower | Loan Amount |
|---|---|---|---|
| Open | Vidal Estela Sosa | $217,000 | |
| Previous Owner | Carey Ii Joseph A | $162,400 |
Source: Public Records
Tax History Compared to Growth
Tax History
| Year | Tax Paid | Tax Assessment Tax Assessment Total Assessment is a certain percentage of the fair market value that is determined by local assessors to be the total taxable value of land and additions on the property. | Land | Improvement |
|---|---|---|---|---|
| 2025 | $400 | $485,100 | $100,000 | $385,100 |
| 2024 | $4,383 | $469,200 | $100,000 | $369,200 |
| 2023 | $4,812 | $445,300 | $100,000 | $345,300 |
| 2022 | $4,639 | $411,400 | $80,000 | $331,400 |
| 2021 | $4,285 | $411,400 | $80,000 | $331,400 |
| 2020 | $4,179 | $348,200 | $72,000 | $276,200 |
| 2018 | $3,431 | $275,400 | $60,000 | $215,400 |
| 2017 | $2,772 | $275,400 | $60,000 | $215,400 |
| 2016 | $2,488 | $237,700 | $60,000 | $177,700 |
| 2015 | $2,467 | $218,800 | $60,000 | $158,800 |
| 2014 | -- | $208,100 | $60,000 | $148,100 |
| 2013 | -- | $194,600 | $60,000 | $134,600 |
Source: Public Records
Map
Nearby Homes
- 318 S Mary Ln
- 39 Mandolin Ave
- 2202 Maryhill St SE
- 2223 Maryhill St SE
- 1819 6th St SE
- 530 S Mary Ave
- 369 S Kentucky Ave
- 17 S Lombard Ave
- 2322 2nd St SE
- 695 S Lyle Ave
- 608 S Lawler Ave
- 2340 2nd St SE
- 1981 Grant Rd
- 2350 2nd St SE
- 182 S Keller Ave
- 2368 2nd St SE
- 1598 Tedford St SE
- 2425 Noah St SE
- 1974 Legendary Ln SE
- 1580 S Kelvin Ct