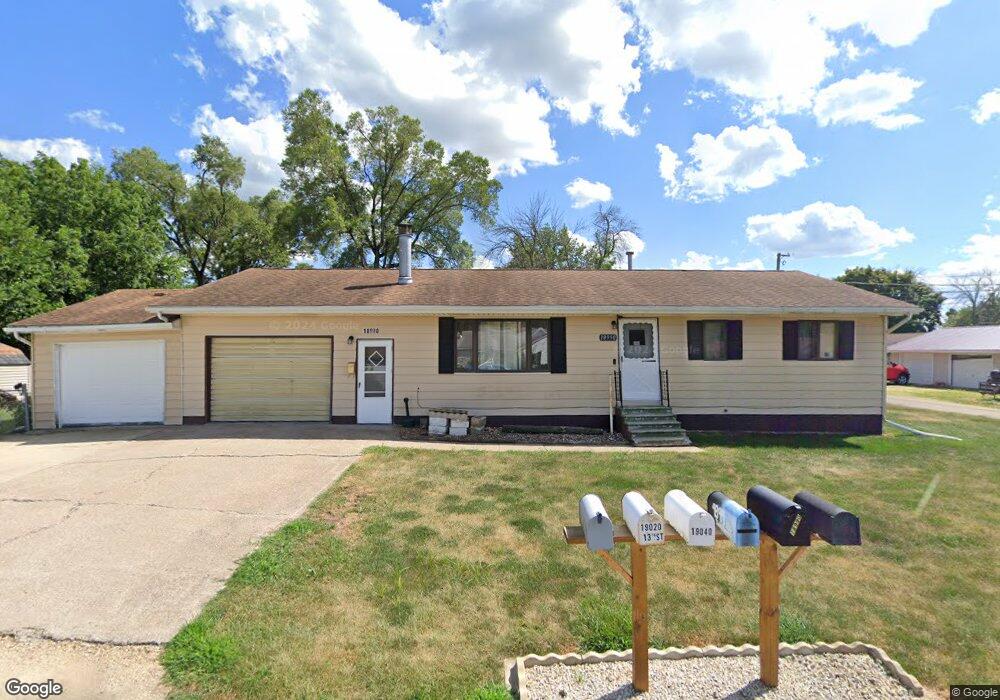
18990 13th St Fulton, IL 61252
Estimated Value: $118,786 - $128,000
2
Beds
--
Bath
1,120
Sq Ft
$109/Sq Ft
Est. Value
About This Home
This home is located at 18990 13th St, Fulton, IL 61252 and is currently estimated at $122,447, approximately $109 per square foot. 18990 13th St is a home located in Whiteside County with nearby schools including Fulton Elementary School, River Bend Middle School, and Fulton High School.
Ownership History
Date
Name
Owned For
Owner Type
Purchase Details
Closed on
Aug 25, 2025
Sold by
Knautz Kyle E and Knautz Kyle
Bought by
Knautz Kyle E
Current Estimated Value
Home Financials for this Owner
Home Financials are based on the most recent Mortgage that was taken out on this home.
Original Mortgage
$68,578
Outstanding Balance
$68,349
Interest Rate
6.95%
Mortgage Type
New Conventional
Estimated Equity
$54,098
Purchase Details
Closed on
Feb 11, 2022
Sold by
Steven L And Susan K Vanoosten Trust
Bought by
Knautz Kyle
Purchase Details
Closed on
May 2, 2017
Sold by
Vanoosten Steven L and Vanoosten Susan K
Bought by
Vanoosten Steven L and Vanoosten Susan K
Purchase Details
Closed on
Nov 2, 2011
Sold by
Bielema Harold Eugene and Bielema Florence L
Bought by
Vanoosten Steven L and Vanoosten Susan K
Create a Home Valuation Report for This Property
The Home Valuation Report is an in-depth analysis detailing your home's value as well as a comparison with similar homes in the area
Home Values in the Area
Average Home Value in this Area
Purchase History
| Date | Buyer | Sale Price | Title Company |
|---|---|---|---|
| Knautz Kyle E | $72,500 | None Listed On Document | |
| Knautz Kyle | $75,000 | Heidy Nicholas W | |
| Vanoosten Steven L | -- | Attorney | |
| Vanoosten Steven L | $80,000 | None Available |
Source: Public Records
Mortgage History
| Date | Status | Borrower | Loan Amount |
|---|---|---|---|
| Open | Knautz Kyle E | $68,578 |
Source: Public Records
Tax History
| Year | Tax Paid | Tax Assessment Tax Assessment Total Assessment is a certain percentage of the fair market value that is determined by local assessors to be the total taxable value of land and additions on the property. | Land | Improvement |
|---|---|---|---|---|
| 2024 | $2,729 | $40,557 | $2,847 | $37,710 |
| 2023 | $2,516 | $37,525 | $2,634 | $34,891 |
| 2022 | $2,390 | $34,405 | $2,415 | $31,990 |
| 2021 | $2,358 | $33,582 | $2,357 | $31,225 |
| 2020 | $2,456 | $34,761 | $2,440 | $32,321 |
| 2019 | $2,506 | $34,705 | $2,436 | $32,269 |
| 2018 | $2,387 | $33,717 | $2,367 | $31,350 |
| 2017 | $2,407 | $33,576 | $2,357 | $31,219 |
| 2016 | $2,368 | $32,827 | $2,304 | $30,523 |
| 2015 | $2,221 | $31,645 | $2,221 | $29,424 |
| 2014 | $2,260 | $32,018 | $2,247 | $29,771 |
| 2013 | $2,221 | $31,645 | $2,221 | $29,424 |
Source: Public Records
Map
Nearby Homes
Your Personal Tour Guide
Ask me questions while you tour the home.