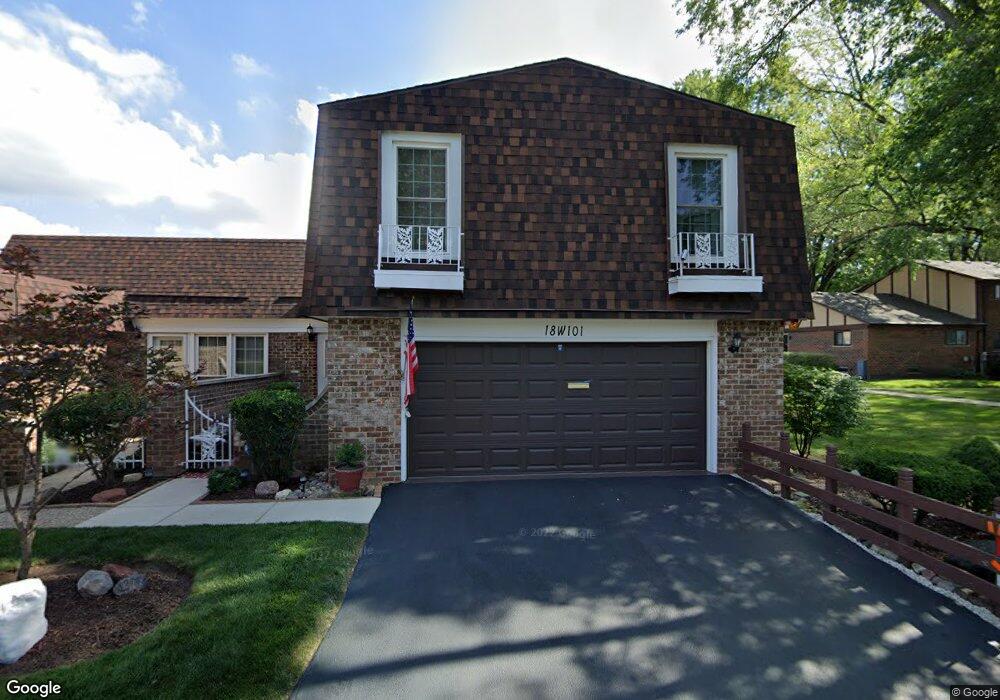
18W101 Williamsburg Ln Unit 1 Villa Park, IL 60181
York Center NeighborhoodEstimated Value: $242,000 - $300,000
--
Bed
--
Bath
1,167
Sq Ft
$225/Sq Ft
Est. Value
About This Home
This home is located at 18W101 Williamsburg Ln Unit 1, Villa Park, IL 60181 and is currently estimated at $262,961, approximately $225 per square foot. 18W101 Williamsburg Ln Unit 1 is a home located in DuPage County with nearby schools including Stevenson School, York Center Elementary School, and Jackson Middle School.
Ownership History
Date
Name
Owned For
Owner Type
Purchase Details
Closed on
Aug 11, 2017
Sold by
Edfors Wesley L
Bought by
The Wesley L Edfors Revocable Trust
Current Estimated Value
Purchase Details
Closed on
Oct 27, 1995
Sold by
Maldonado Mary Jo
Bought by
Edfors Wesley L
Home Financials for this Owner
Home Financials are based on the most recent Mortgage that was taken out on this home.
Original Mortgage
$60,000
Interest Rate
7.65%
Mortgage Type
Purchase Money Mortgage
Purchase Details
Closed on
Jul 14, 1994
Sold by
Bowling Link Allen and Bowling Karen R
Bought by
Maldonado Mary Jo
Home Financials for this Owner
Home Financials are based on the most recent Mortgage that was taken out on this home.
Original Mortgage
$117,450
Interest Rate
8.73%
Mortgage Type
Purchase Money Mortgage
Create a Home Valuation Report for This Property
The Home Valuation Report is an in-depth analysis detailing your home's value as well as a comparison with similar homes in the area
Home Values in the Area
Average Home Value in this Area
Purchase History
| Date | Buyer | Sale Price | Title Company |
|---|---|---|---|
| The Wesley L Edfors Revocable Trust | -- | Attorney | |
| Edfors Wesley L | $134,000 | Law Title | |
| Maldonado Mary Jo | $130,500 | -- |
Source: Public Records
Mortgage History
| Date | Status | Borrower | Loan Amount |
|---|---|---|---|
| Closed | Edfors Wesley L | $60,000 | |
| Previous Owner | Maldonado Mary Jo | $117,450 |
Source: Public Records
Tax History Compared to Growth
Tax History
| Year | Tax Paid | Tax Assessment Tax Assessment Total Assessment is a certain percentage of the fair market value that is determined by local assessors to be the total taxable value of land and additions on the property. | Land | Improvement |
|---|---|---|---|---|
| 2024 | $3,631 | $78,985 | $7,905 | $71,080 |
| 2023 | $3,735 | $73,040 | $7,310 | $65,730 |
| 2022 | $3,889 | $63,470 | $6,350 | $57,120 |
| 2021 | $3,745 | $61,890 | $6,190 | $55,700 |
| 2020 | $3,649 | $60,530 | $6,050 | $54,480 |
| 2019 | $3,409 | $57,550 | $5,750 | $51,800 |
| 2018 | $2,985 | $49,520 | $4,950 | $44,570 |
| 2017 | $2,703 | $45,380 | $4,540 | $40,840 |
| 2016 | $2,545 | $41,500 | $4,150 | $37,350 |
| 2015 | $2,438 | $38,670 | $3,870 | $34,800 |
| 2014 | $3,125 | $46,140 | $4,620 | $41,520 |
| 2013 | $3,077 | $46,780 | $4,680 | $42,100 |
Source: Public Records
Map
Nearby Homes
- 18W152 16th St Unit 8
- 1S266 Dillon Ln
- 1S252 Stratford Ln Unit 4
- 1S209 Stratford Ln
- 18W118 14th St Unit 4
- 1S134 Holyoke Ln Unit G
- 1S122 Stratford Ln Unit 3
- 1507 S Addison Ave
- 1S128 Addison Ave
- 1500 S Ardmore Ave Unit 408
- 1618 Astor Ave
- 1302 S Luther Ave
- Lot 1 S Meyers Rd
- Lot 11 S Meyers Rd
- Lot 7 S Meyers Rd
- Lot 8 S Meyers Rd
- Lot 6 S Meyers Rd
- Lot 9 S Meyers Rd
- Lot 5 S Meyers Rd
- Lot 10 S Meyers Rd
- 18W097 Williamsburg Ln Unit 3
- 18W099 Williamsburg Ln
- 18W095 Williamsburg Ln
- 1S276 Stratford Ln Unit 1
- 1S282 Stratford Ln Unit 3
- 1S286 Stratford Ln Unit 1
- 1S284 Holyoke Ln Unit 3
- 18W093 Williamsburg Ln Unit 5
- 18W093 Williamsburg Ln Unit 93
- 1S280 Stratford Ln
- 18W142 Buckingham Ln
- 18W100 Jamestown Ln Unit 1
- 18W094 Jamestown Ln Unit 4
- 18W098 Jamestown Ln Unit 2
- 1S274 Stratford Ln Unit 2
- 18W096 Jamestown Ln Unit 3
- 1S278 Stratford Ln Unit 5
- 18W146 Buckingham Ln Unit 4
- 18W144 Buckingham Ln Unit 5
- 232W Buckingham Ln Unit 232